
TrueNAS
Pool capacity, health, disks, datasets and alerts from TrueNAS SCALE on the Home dashboard, the NAS screen and the Mac Storage workspace.
iPhoneMacOn this page
TrueNAS SCALE is the storage OS most homelabs run on the actual NAS. Pocket Homelab reads its REST API to show pool capacity and health, disks, datasets and alerts, and to fold a pool summary into the Home dashboard and Server stats.
What you get
- Home row “NAS” (ring gauge): “62%”/“used” (or free space with the “Free storage” headline); lines “pool
healthy” / “POOL DEGRADED”, free of total, and the warmest disk temperature when
TEMPS_URLis set. - Home header option “NAS storage”:
tank 62% used · 4.20 TB free, ortank DEGRADED · 62% used. - Issue chip “Pool tank degraded” (red) whenever a pool reports unhealthy.
- Spotlight entry “NAS” (truenas, pool, storage, zfs); a browser link “TrueNAS” in Open in Browser.
- ntfy category
storage(keywords disk, smart, pool, zfs, space, storage, nas) deep-links to Open NAS. - Mac: the Storage workspace in the sidebar’s Infrastructure group, a Storage widget on Home, a TrueNAS entry in the Home Status widget with status Healthy / Degraded / Nearly full (above 90% used) / Partial data / Unavailable, and the pool’s free space as a card in the menu bar item’s menu.
- Notes: the Homelab snapshot block in the note editor’s
/menu has a Storage row.
Set up
- In TrueNAS: Settings → API Keys → Add. A read-only key is enough, Pocket Homelab only issues GET requests (system info, pools, disks, alerts, datasets).
- In Pocket Homelab: Settings → Services → TrueNAS, paste the base URL and key, then Test connection.
| Key | Field | Required | Secret | Where to get it |
|---|---|---|---|---|
TRUENAS_URL | TrueNAS URL | Required | — | Base URL of your TrueNAS instance. Leave empty to hide TrueNAS features. |
TRUENAS_API_KEY | TrueNAS API Key | Required | Secret | Read-only key is enough (pool capacity + health). Leave empty to hide the NAS row. |
On iPhone
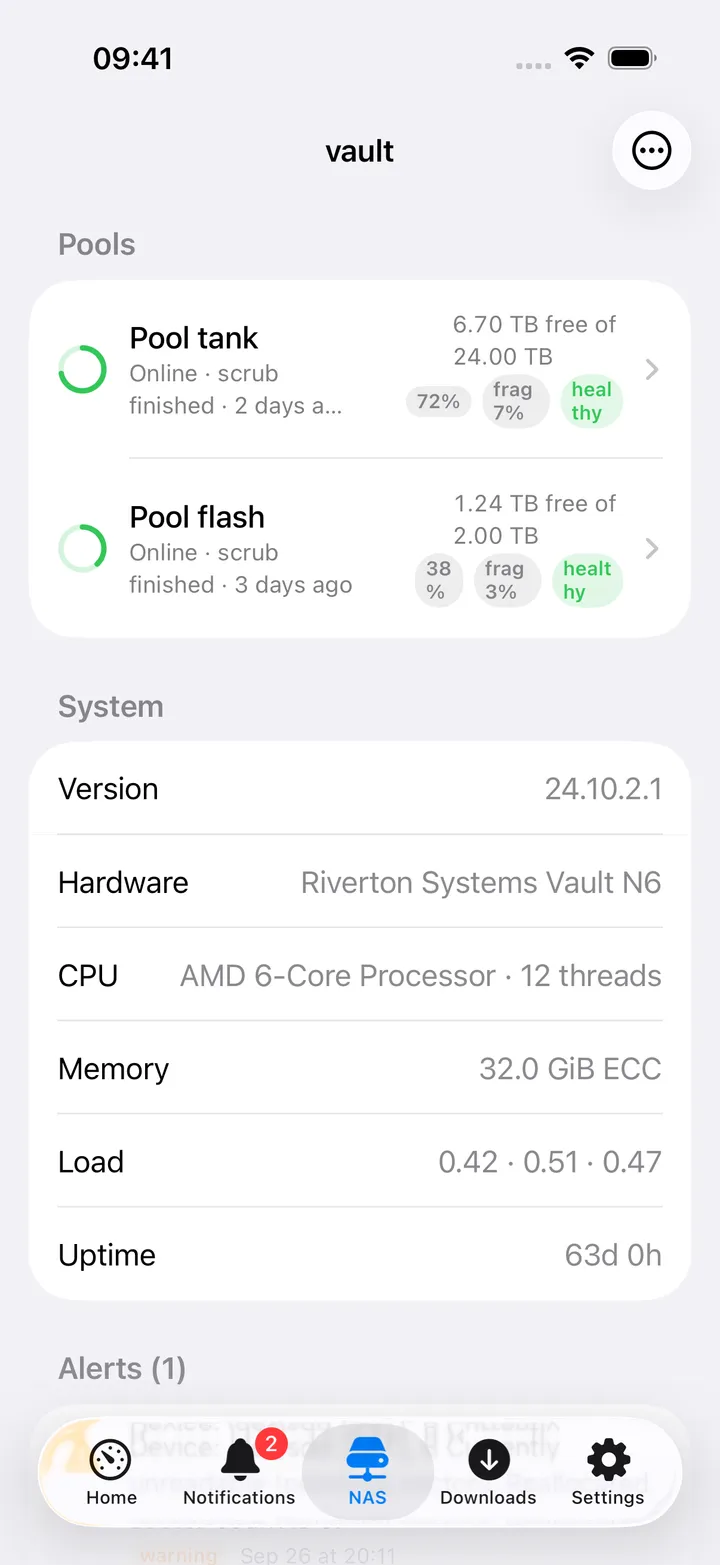
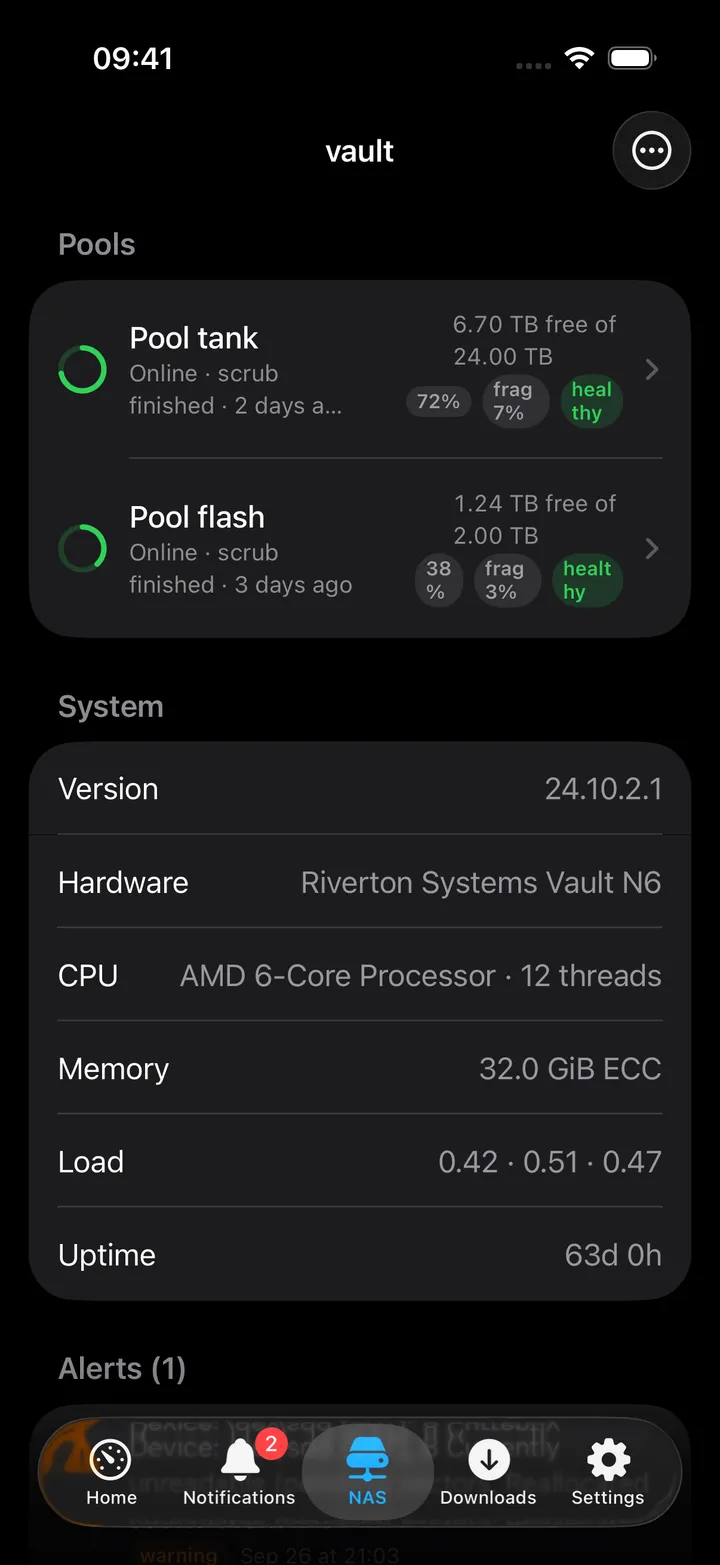
The NAS screen (titled after your hostname) polls every 30 seconds and lists, in order: Pools (status,
free/total, fragmentation, a health tag), System (version, hardware, CPU, memory, load, uptime), Alerts
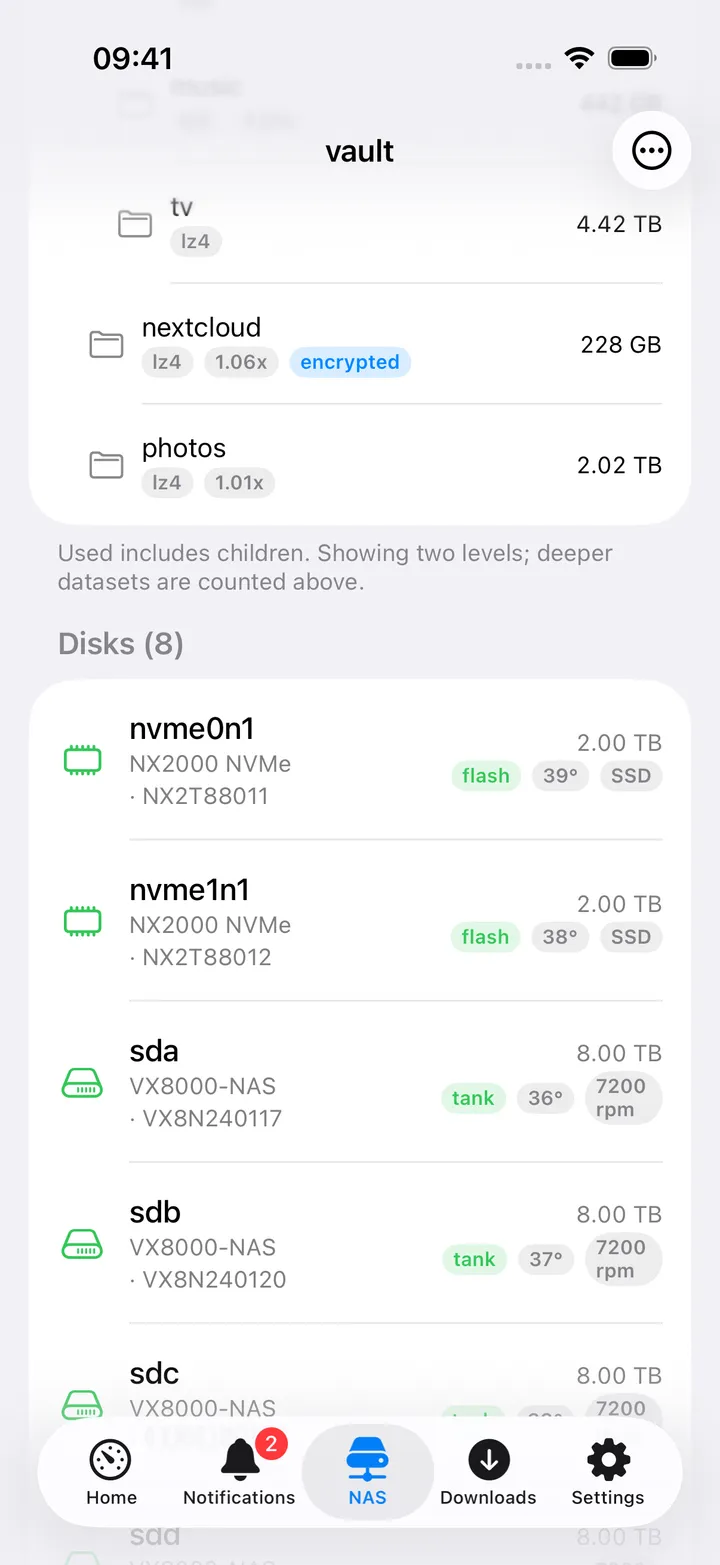
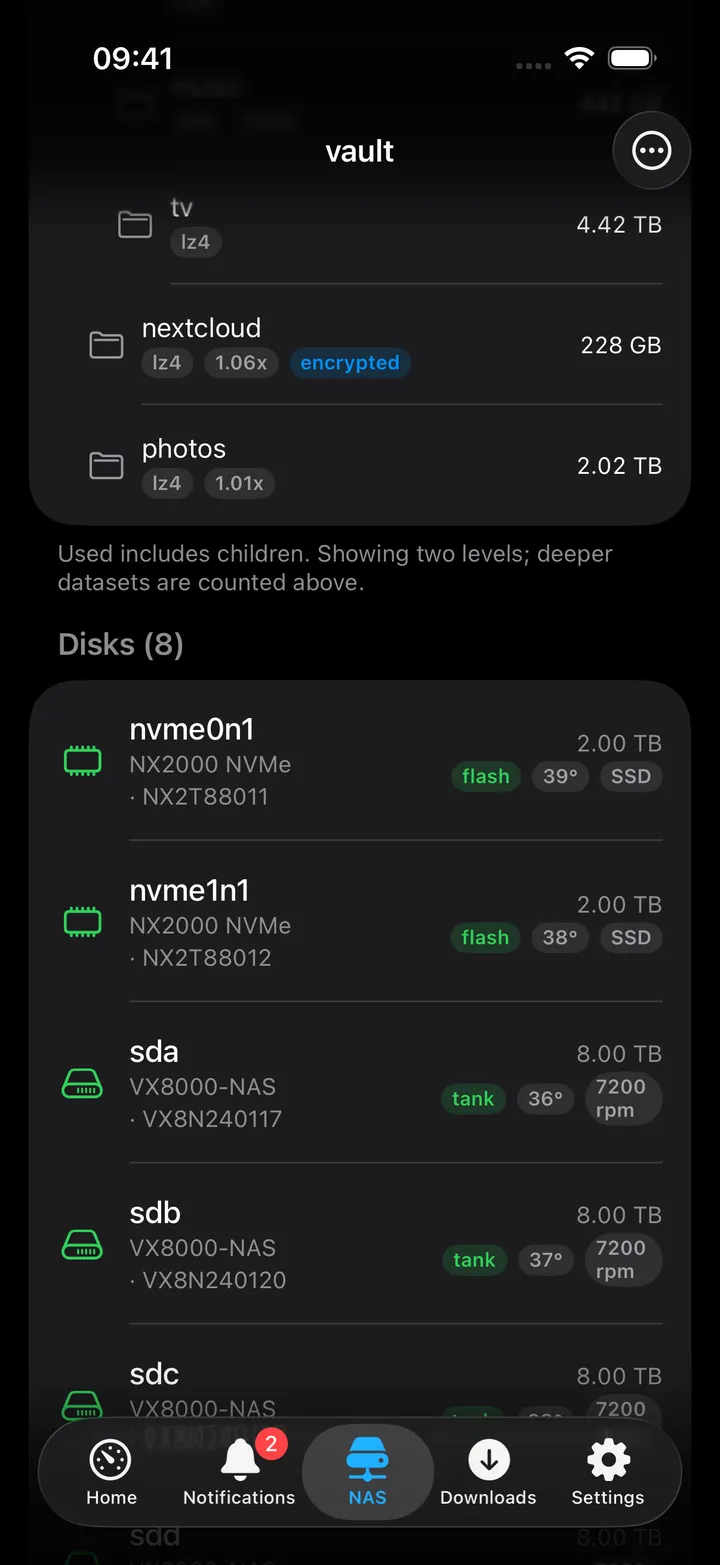
(active first, then a collapsed “Dismissed (N)” group), Datasets (the pool and two levels below it, with compression
ratio and quota/free space), and Disks (model, serial, temperature when TEMPS_URL reports it, and which
pool each belongs to). Tapping a pool opens Pool detail with scrub status and one section per vdev, listing
read/write/checksum error counts per member disk.
On Mac
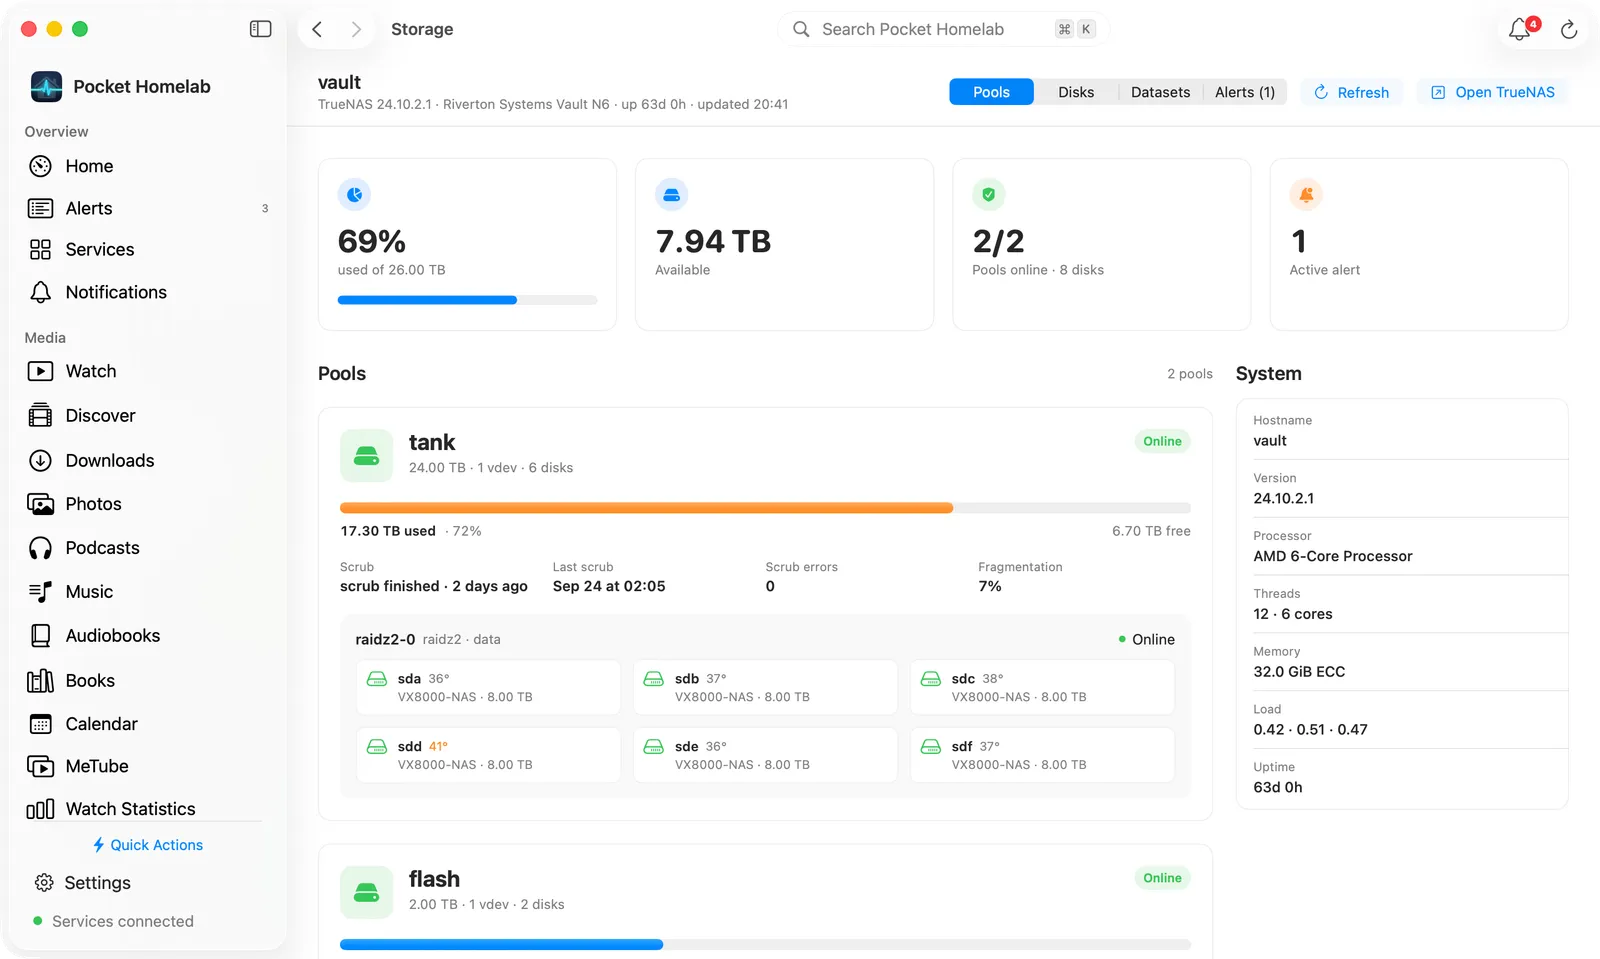
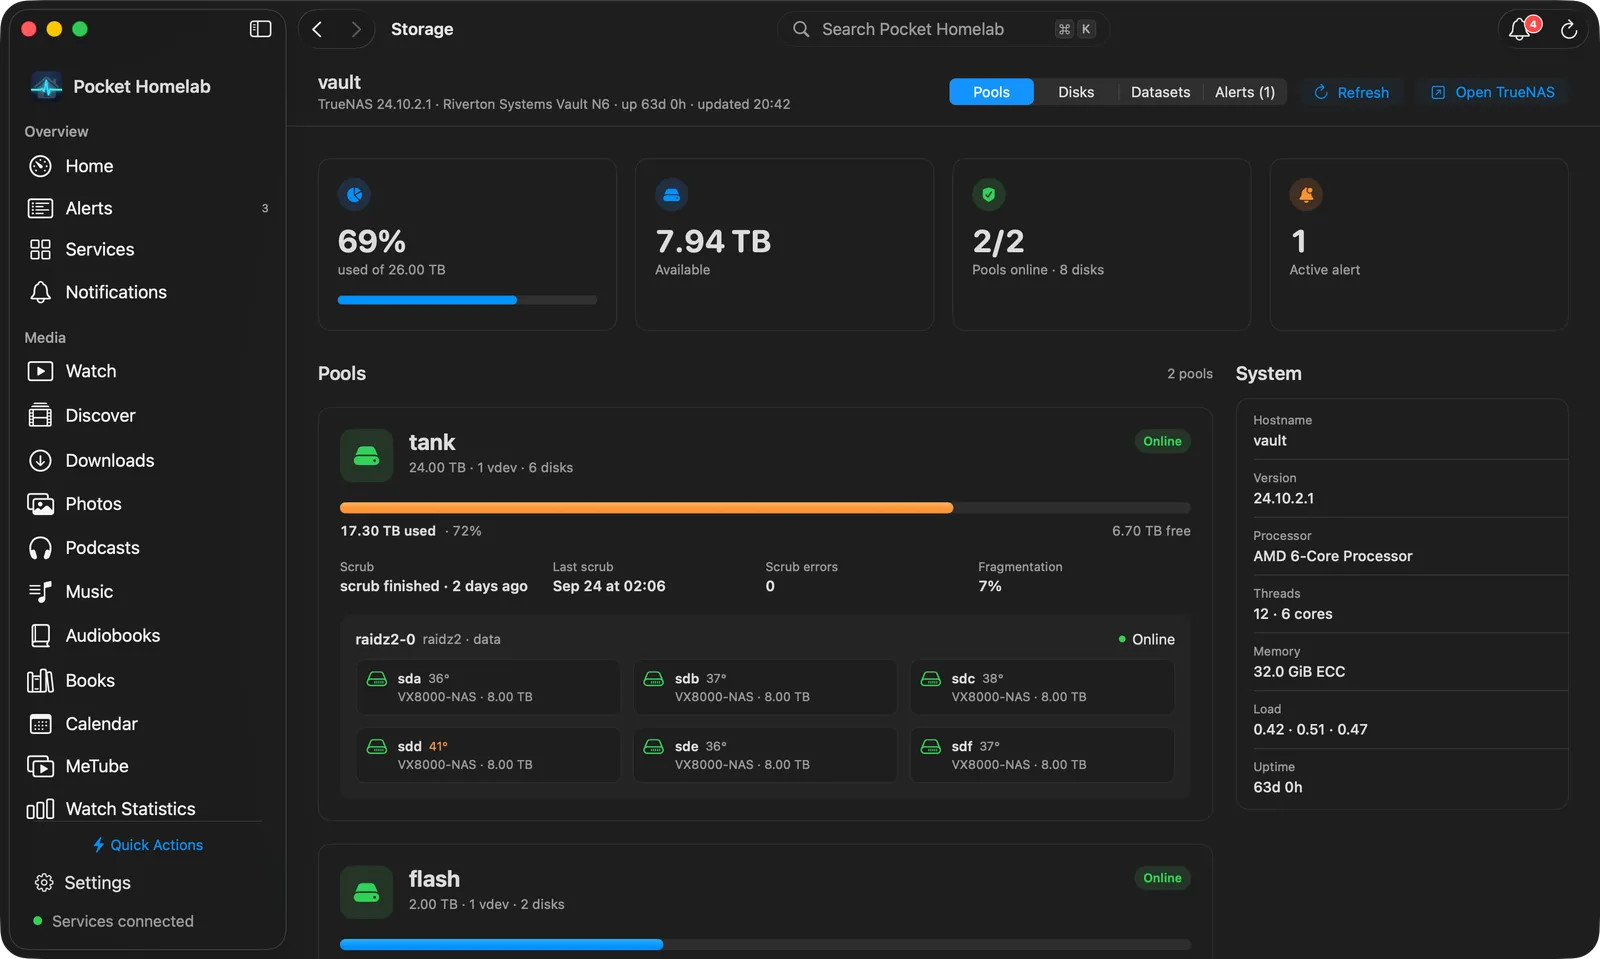
The Storage workspace (⌘7 by default) opens with a bar named after your NAS’s hostname, with the TrueNAS version, the hardware, the uptime and the time of the last update under it. On the right are the sections Pools, Disks, Datasets and Alerts (the last with a count while alerts are active), Refresh and Open TrueNAS.
Four tiles sit under the bar: the share used of your total capacity, the space available, how many pools are online (with the disk count, or how many pools need attention) and the number of active alerts. Then the chosen section:
- Pools: a card per pool with its size, vdev and disk count, a status pill and a usage bar with used and free
space. Under it are the scrub state, the last scrub, scrub errors and fragmentation, then every vdev (type,
role, status) with its disks as small cards: model and size, the temperature from
TEMPS_URL, and read, write and checksum error counts when there are any. A System card beside the pools lists hostname, version, processor, threads and cores, memory (marked ECC when it is), load and uptime. - Disks: a card per physical disk with its name, model, the pool it belongs to (or Unassigned), capacity, type and bus, rotation speed and temperature. Hover a card for the serial number; right-click for Copy serial number.
- Datasets: every dataset as a tree, with a used bar, available space, compression and its ratio, a lock for encrypted datasets and the quota when one is set. Filter datasets matches a name or mount point; right-click a row for Copy path.
- Alerts: a card per alert with its level, how long ago it happened (hover for the date) and the full text. Include dismissed adds the dismissed ones, dimmed. Right-click for Copy alert.
The workspace refreshes every 30 seconds while it is open. Without a TrueNAS URL and key it shows Connect your storage and an Open Settings button.
On Home, the Storage widget shows a ring with the pool’s used share, the free space, the pool name and
size and “Pool healthy” or “Pool degraded”, then used space, capacity, the warmest disk and health; larger sizes
add an allocation bar and the NAS disk temperatures from TEMPS_URL. Click the widget for its detail panel.
In Settings → Menu Bar the pool is one of the disks a reading can show: free space, used space, size, or
free of total, in the menu bar itself or as a card in its menu. Warmest NAS disk (needs TEMPS_URL) is a
reading too.
Actions
None. There is no alert dismissal or scrub trigger from Pocket Homelab, everything here is read-only.
Works with
- Glances/Server stats: the first pool is folded into the same Stats screen and the Home “Server” flow shares the snapshot.
TEMPS_URLNAS readings add disk temperature tags here and on the Home NAS card.- Glances: the first pool also appears as a tile and a Storage row on the Mac Server page.
- An Uptime Kuma monitor named “TrueNAS” or “NAS” supplies the latency shown for this service in the Mac Home Status widget.
- Nextcloud Notes: the Homelab snapshot block has a Storage row with the pool’s state.
Tips & troubleshooting
- A URL with no API key shows “No credentials” and hides the NAS row entirely, both keys are required.
- Home and Stats only ever show the first pool from
/api/v2.0/pool; multi-pool systems see every pool on the full NAS screen and the Mac Storage workspace. - The app asks TrueNAS for at most 200 datasets. The iPhone NAS screen shows the pool and two levels below it, to keep the list readable on deep dataset trees; the Mac Datasets section shows the whole tree it received.