Uptime Kuma
Monitor status, response times and 24-hour uptime on the Home dashboard, the Monitors screen and the Mac Monitors workspace.
iPhoneMacOn this page
Uptime Kuma watches whether your other services are actually up. Pocket Homelab reads its monitors two different ways, a public status page, or an API key for everything, and surfaces down monitors as an issue chip everywhere in the app.
What you get
- Home row “Monitors”: “12 up” or “3 down”, with “all responding” or “3 DOWN: a, b, c” and, when nothing is down, “slowest <name> · 120 ms”.
- Issue chip “1 monitor down” / “N monitors down” (red), counted in the “N issues” header banner.
- Spotlight entry “Monitors” (uptime, kuma, status).
- iPhone widgets and Shortcuts: a monitors row in the Right Now widget, and the Homelab Status action says which monitors are down (see Widgets and Shortcuts).
- Mac: sidebar Monitors under Infrastructure, a Monitors widget for Home (up and down counts, pending, average ping and the slowest monitor, then the down or slowest monitors), and a Monitors row in the Home Status widget with Healthy / N down / Attention (pending/maintenance) / No monitors and “N up”.
- Mac menu bar: the row “Monitors” (“9 / 12 up”) in its menu, and the readings Monitors up and Monitors down (labelled “Kuma”) that you can put beside the icon in Settings → Menu Bar.
- A monitor named to match a service alias (Server/Glances, TrueNAS/NAS, AdGuard/AdGuard Home, Jellyfin, qBittorrent/SABnzbd, Uptime Kuma/Kuma) supplies that service’s response time in the Mac Home Status widget (with Show response times on, the default).
- Included in the built-in sample workspace, in API-key mode.
Set up
Kuma can be read two ways, pick whichever fits how much of it you want to expose:
- Full access (all monitors): in Kuma, go to Settings → API Keys and create a key. Every monitor is then
read from
/metrics, with no groups and no 24-hour uptime figure. - Status page only: create or use an existing public status page and note its slug from the URL
(
/status/<slug>). Only the monitors published on that page are shown, but you do get groups and 24h uptime. - In Pocket Homelab: Settings → Services → Uptime Kuma, paste the URL plus either the API key or the status page slug (or both, the key wins), then Test connection.
| Key | Field | Required | Secret | Where to get it |
|---|---|---|---|---|
KUMA_URL | Uptime Kuma URL | Required | — | Base URL of your Uptime Kuma instance. Leave empty to hide Uptime Kuma features. |
KUMA_STATUS_SLUG | Status page slug | Optional | — | Slug of a public status page (used when no API key is set). |
KUMA_API_KEY | API key | Optional | Secret | Settings → API Keys. With a key every monitor is read from /metrics, not just the status page. |
On iPhone
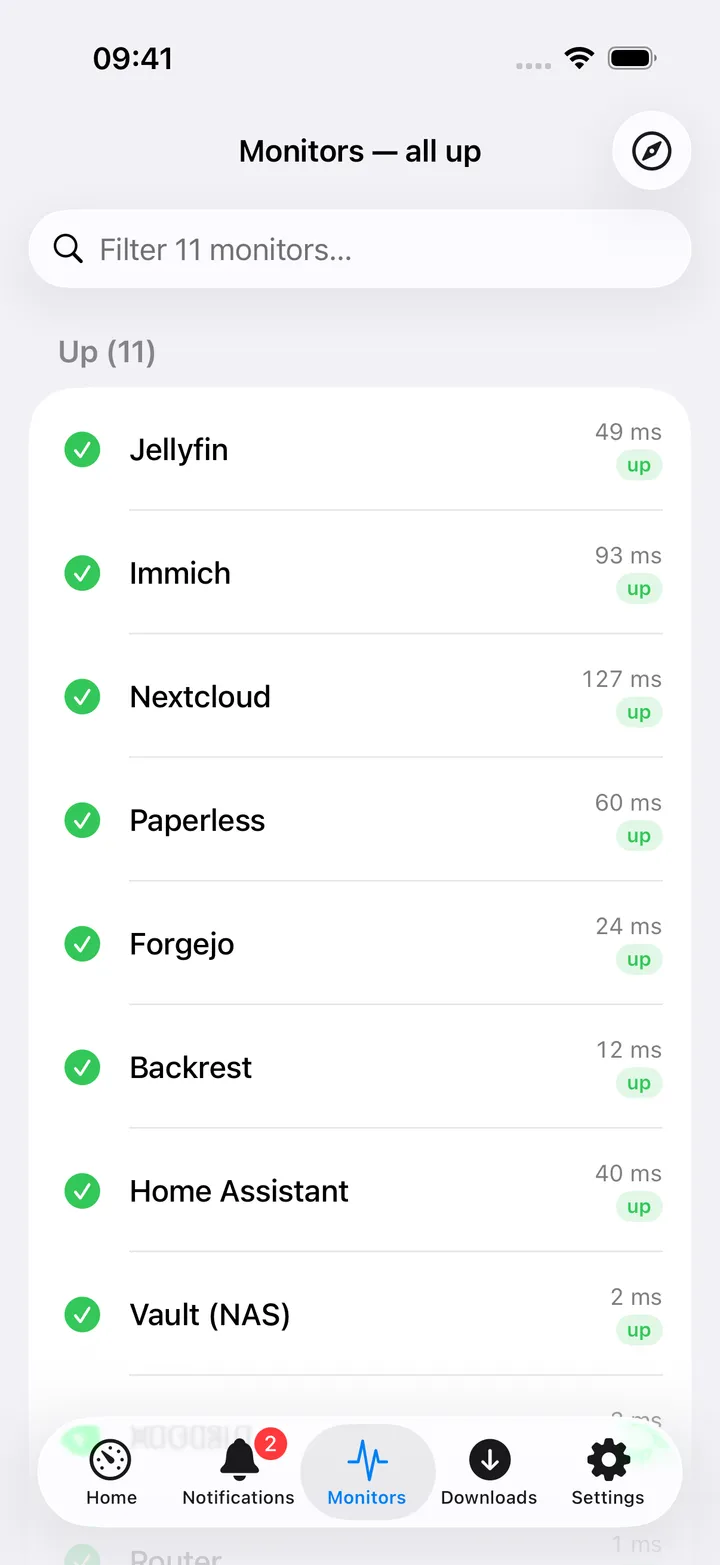
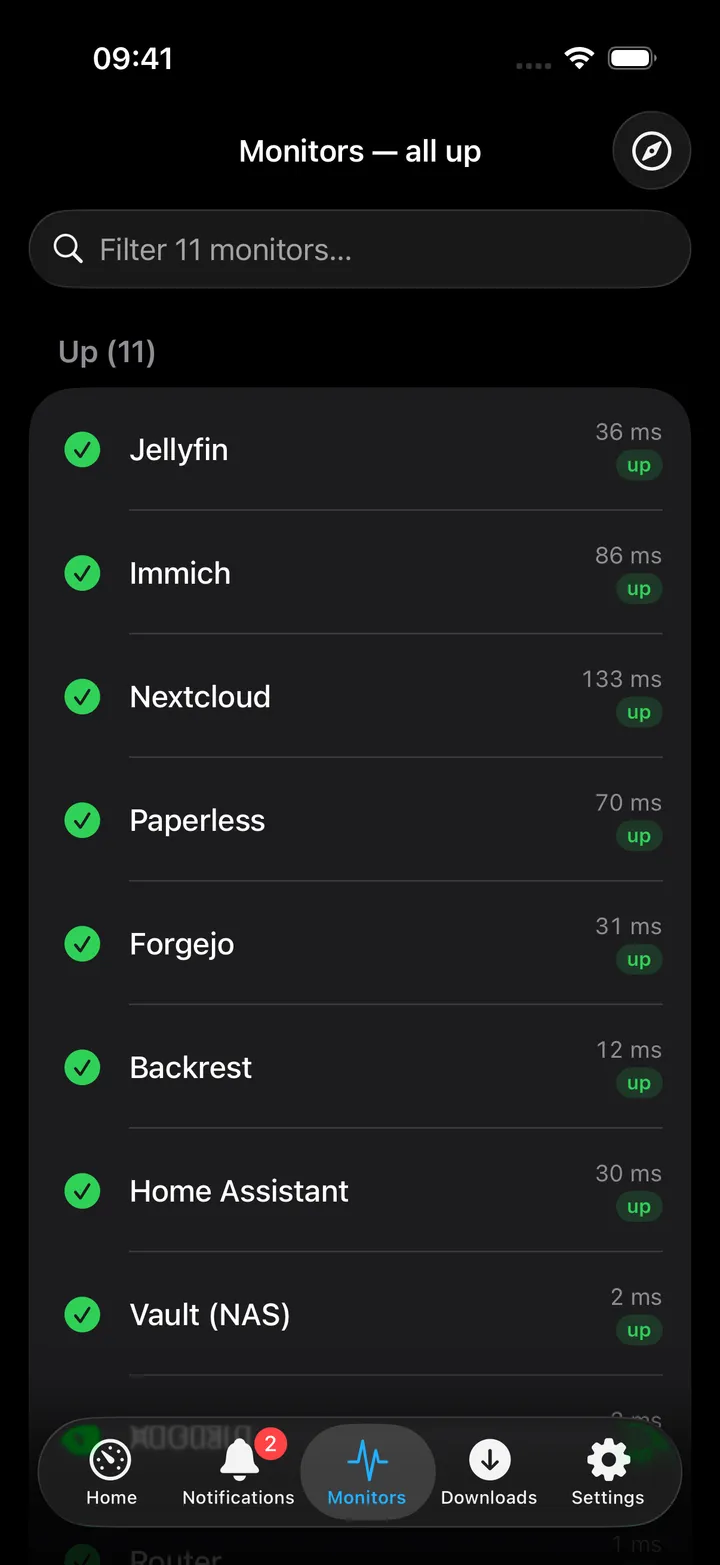
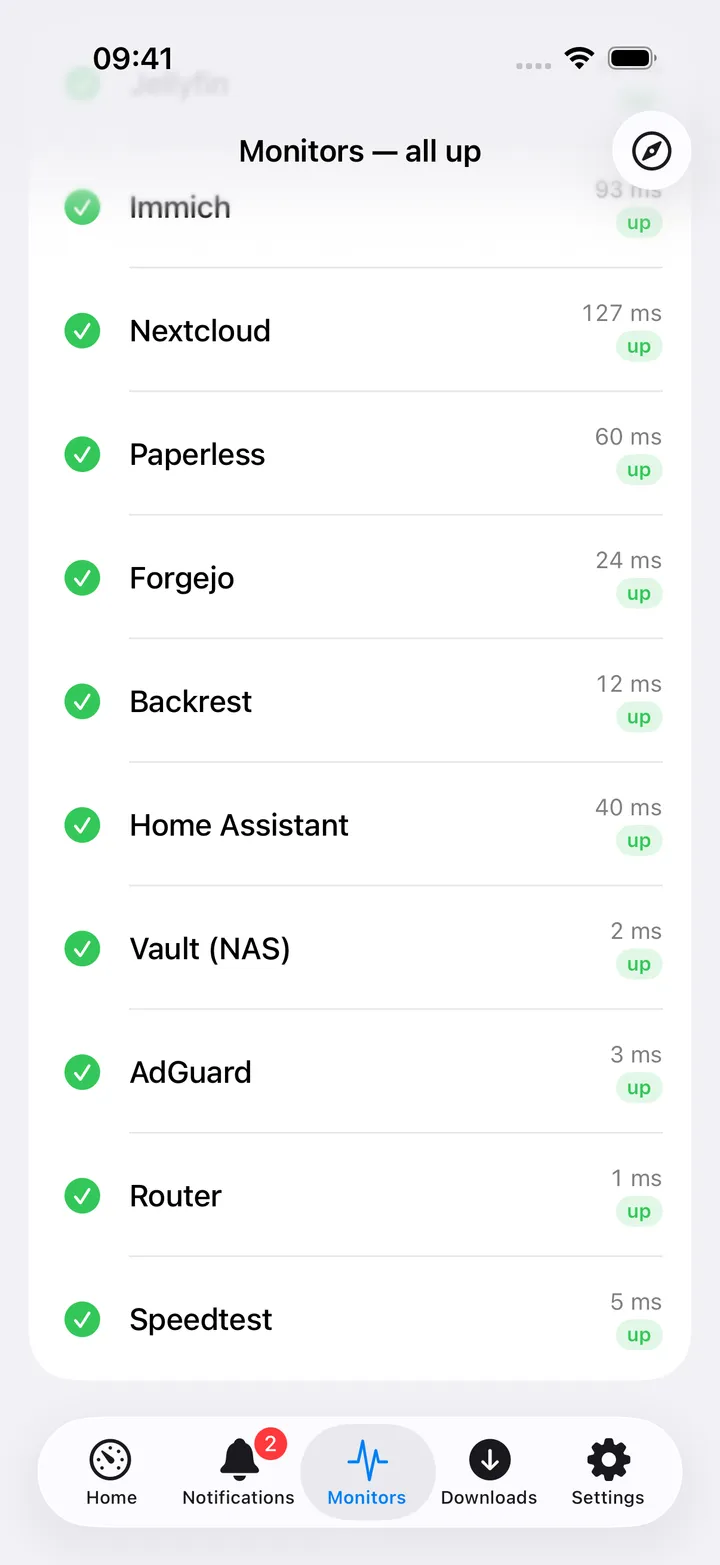
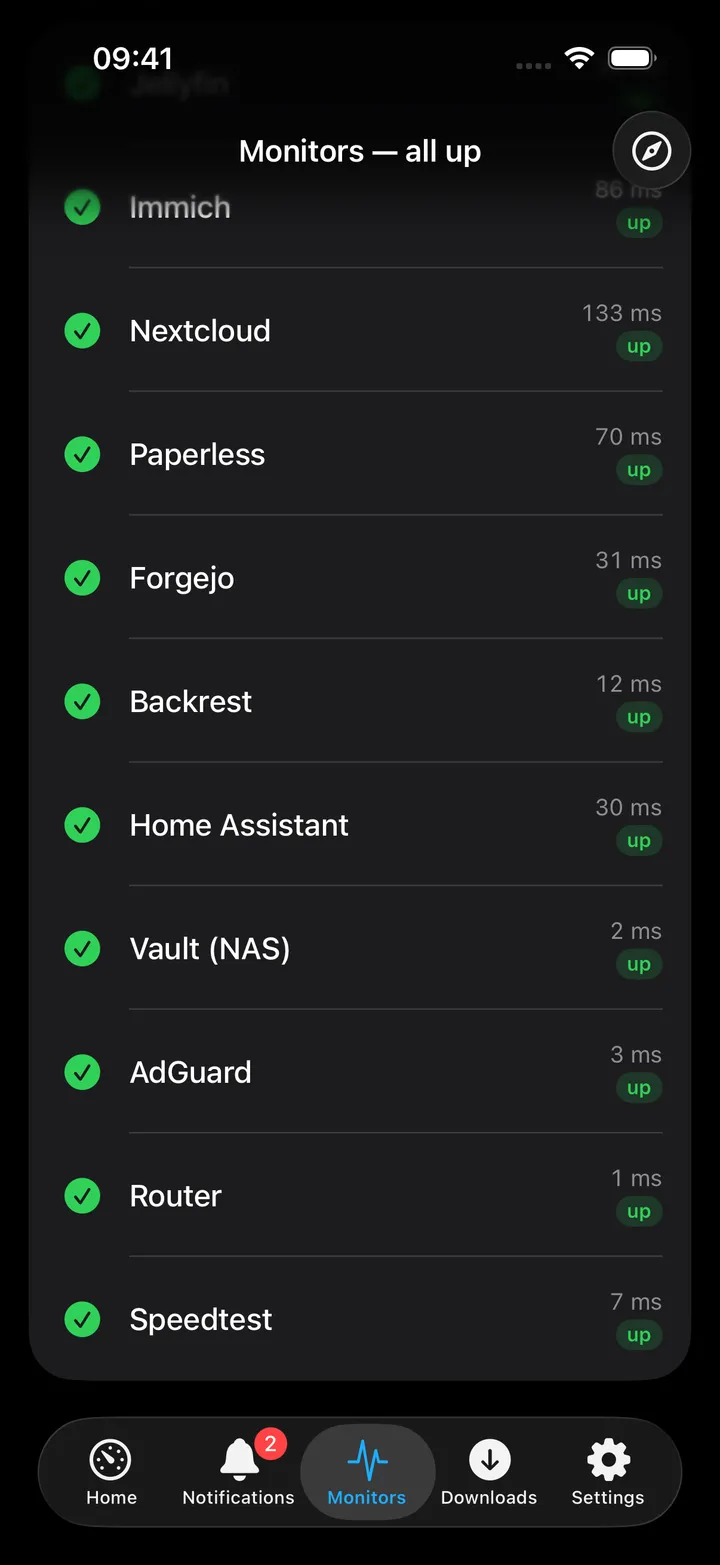
The Monitors screen (titled “Monitors, 3 DOWN” or “Monitors, all up” once loaded) polls every 15 seconds and splits monitors into Down, Pending / Maintenance and Up sections, each showing response time and, in status-page mode, 24-hour uptime and the group name. A search field filters by name or group, pull down to ask Kuma again, and Open Uptime Kuma is in the toolbar. Long-press a monitor for Copy name. In status-page mode a footer notes “status page only, add a Kuma API key for all monitors.”
On Mac
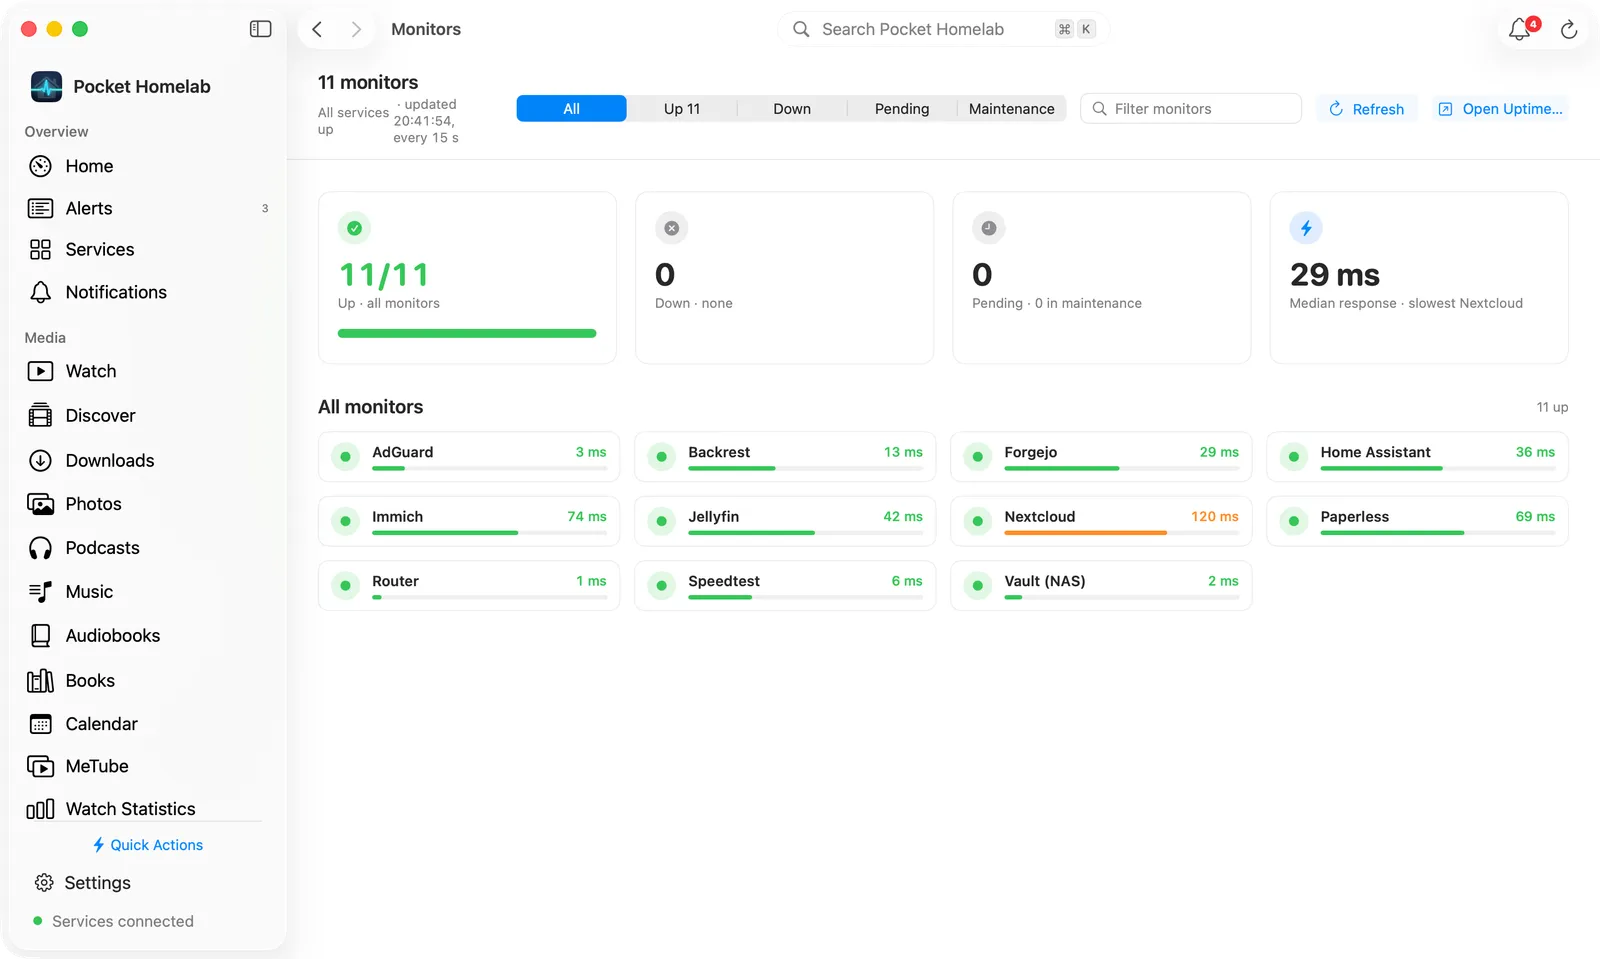
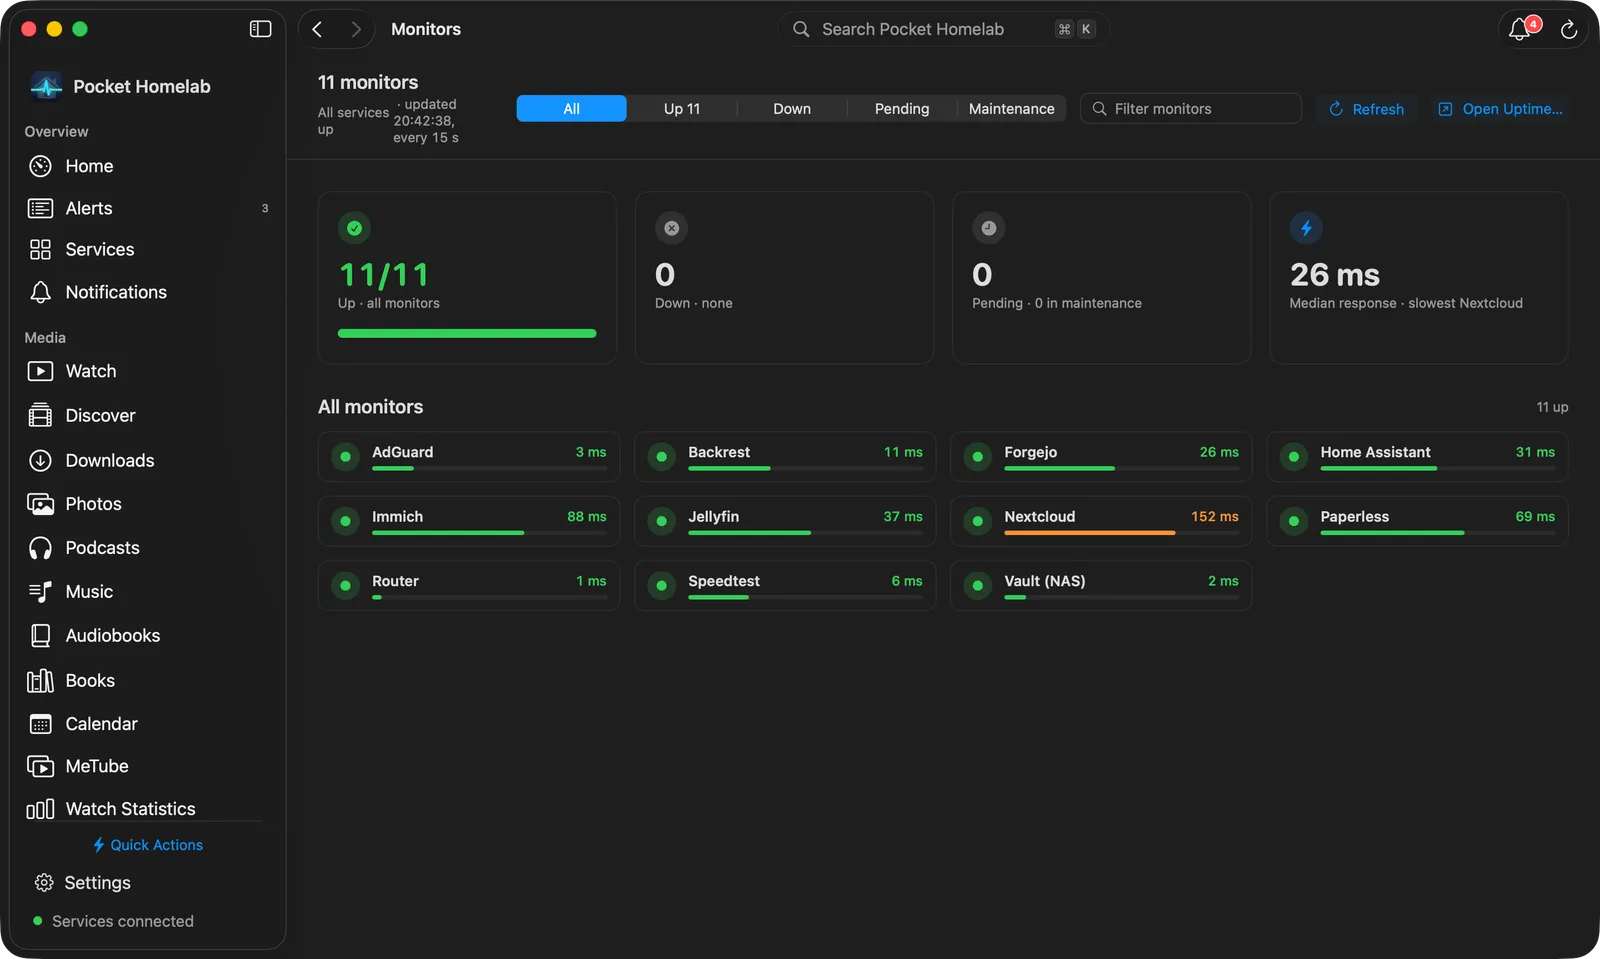
The Monitors workspace (⌥⌘1 by default) opens with a bar that counts your monitors and says “All services up”, how many are down, or how many are pending or in maintenance, with the time of the last update (“every 15 s”). On the right are a status filter (All, Up, Down, Pending, Maintenance, each with its count), Filter monitors (matches a name or group), Refresh and Open Uptime Kuma.
Four tiles follow: monitors up out of the total, monitors down, pending (with how many are in maintenance) and the median response time with the slowest monitor. Every monitor that is not up comes first under Needs attention. The rest are small cards grouped as in Uptime Kuma, each with a status dot, the name, the response time on a short bar (green under 100 ms, orange under 500 ms, red beyond) and, in status-page mode, the 24-hour uptime. Right-click a card for Copy name and Open Uptime Kuma. In status-page mode a note at the bottom says an API key would include all monitors.
Actions
None. Kuma monitors are read-only from Pocket Homelab, there is no pause, acknowledge or retest control here.
Works with
- The Home issue chip and “N issues” banner count down monitors alongside AdGuard, TrueNAS, Scrutiny and Backrest.
- Mac Home Status widget: any monitor named to match a service alias feeds that service’s response time.
- Nextcloud Notes: the What needs attention block (from the
/menu or the wrench in the note toolbar) writes which monitors are down and, with a status page slug, a table of the outages of the past week (monitor, down from, for how long) worked out from Uptime Kuma’s recent heartbeats. With an API key alone it can only say what is down now. The block also covers Scrutiny and Backrest when they are set up.
Tips & troubleshooting
- Status page vs API key is the main decision here: the status page is easy to set up (no key management) but only shows what you chose to publish, with no per-monitor breakdown beyond groups; an API key shows everything but flattens groups and drops the 24-hour uptime number. You can set both, the key takes priority.
- A rejected API key surfaces as
Kuma /metrics → HTTP 401, API key rejected; a valid key is 44 characters and starts withuk. - Monitors without a status line in
/metricsdefault to “up” rather than showing as unknown. - Rows are keyed by “group/name” internally, because monitor IDs can collide across groups in status-page mode.