Scrutiny
SMART disk health, temperatures and attributes on the Home dashboard, the Disk Health screen and the Mac Disks workspace.
iPhoneMacOn this page
Scrutiny collects SMART data from every disk it watches and flags the ones heading for trouble. Pocket Homelab reads its summary API to show disk health at a glance, with full SMART attributes one tap away.
What you get
- Home row “Disks”: “8 OK” or “2 warn”, with “SMART all passed” or “SMART warnings: host:sda, host:sdb” (up to three names).
- Issue chip “SMART: 1 warning” / “SMART: N warnings” (red).
- Spotlight entry “Disks” (smart, scrutiny, health).
- Mac: the Disks workspace in the sidebar’s Infrastructure group, a Disks widget on Home, and a Disk health entry in the Home Status widget with status Healthy / Warnings / No disks / Unavailable and fields for disk and warning counts.
- Notes: the What needs attention and Homelab snapshot blocks in the note editor’s
/menu.
Set up
- Scrutiny has no built-in authentication, so there is nothing to create in its own UI, just have it running and reachable.
- In Pocket Homelab: Settings → Services → Scrutiny, paste the base URL, then Test connection.
| Key | Field | Required | Secret | Where to get it |
|---|---|---|---|---|
SCRUTINY_URL | Scrutiny URL | Required | — | Base URL of your Scrutiny instance. Leave empty to hide Scrutiny features. |
On iPhone
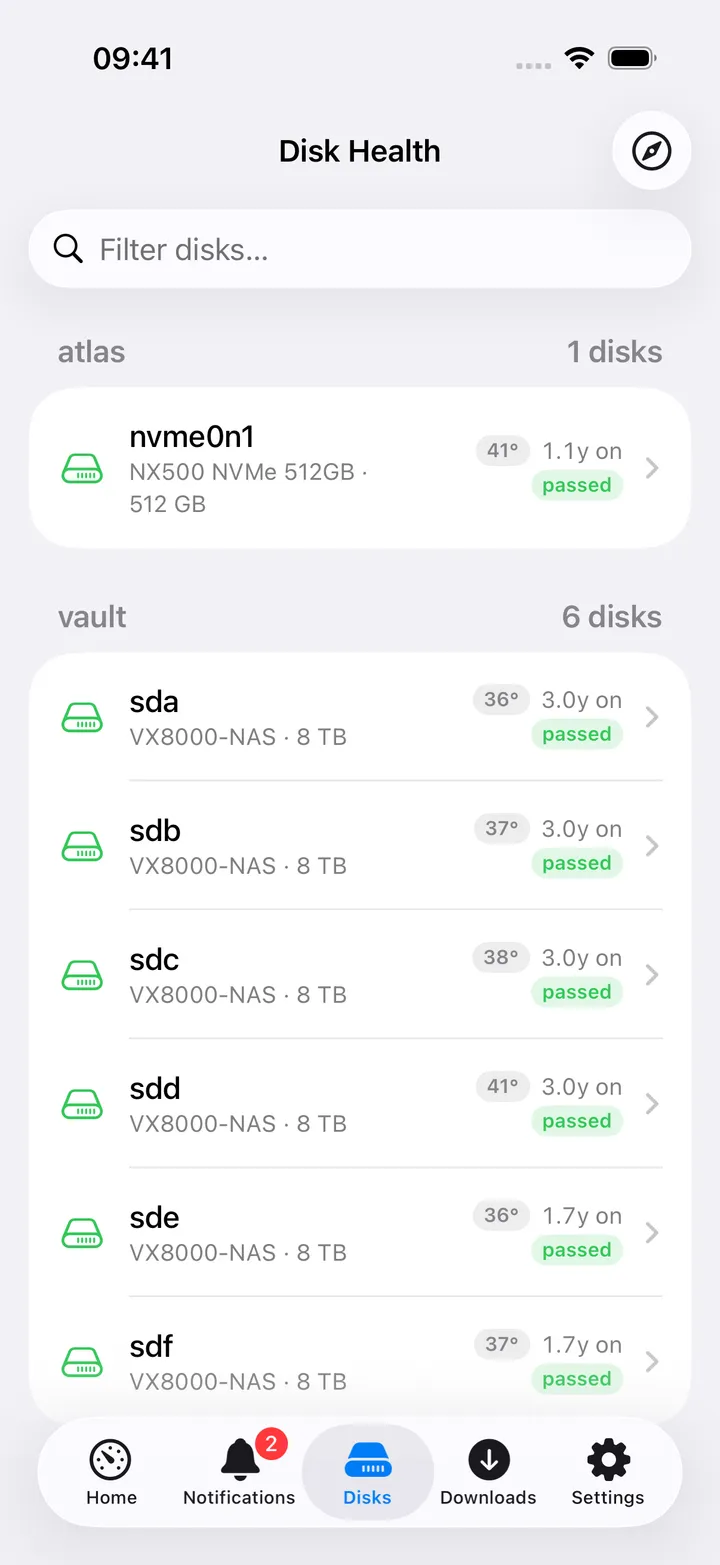
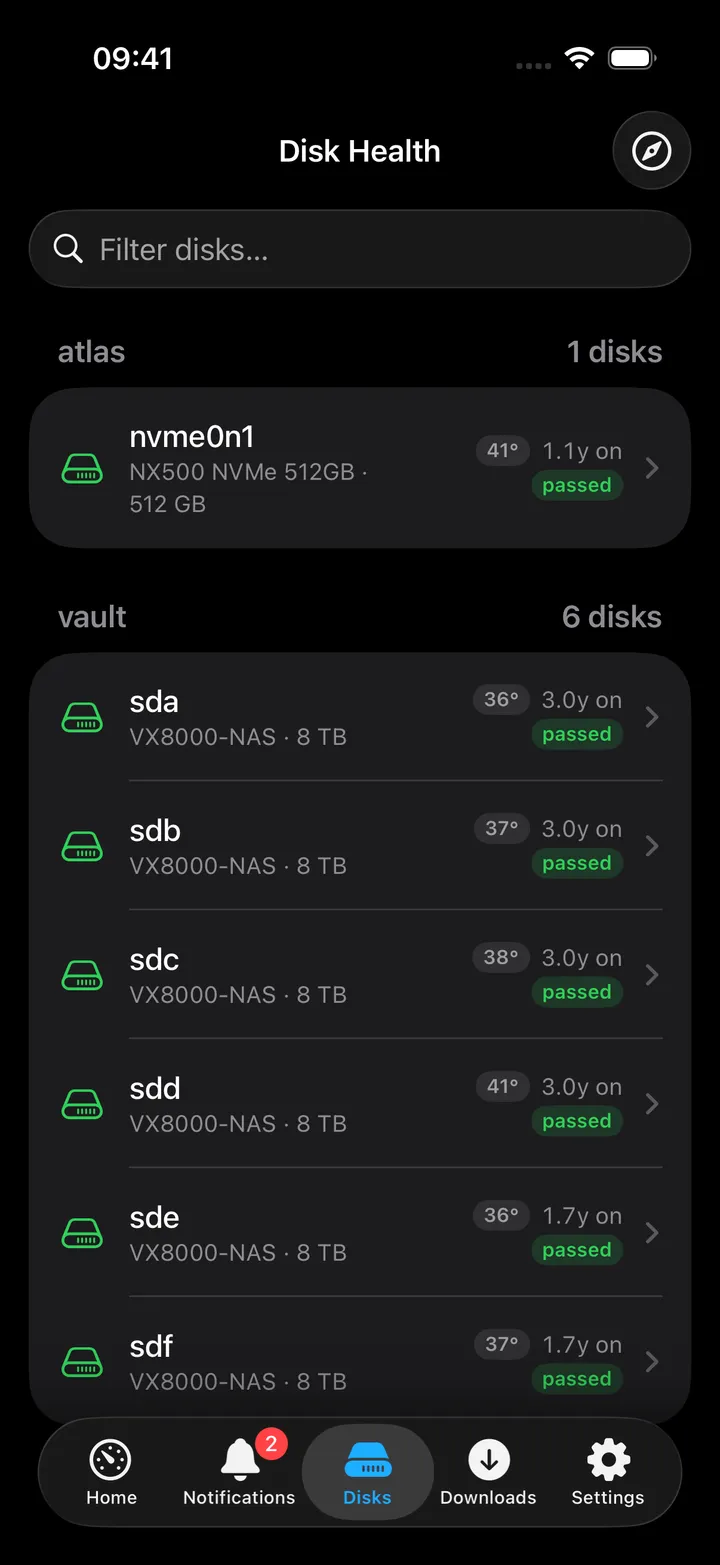
The Disk Health screen groups disks by host, each row showing model and capacity, a status tag (passed, SMART failed, thresholds failed, or warning), a temperature tag (orange near the warning threshold), and power-on age. A search field filters by name, model, serial or host. The list loads once per visit rather than polling continuously.
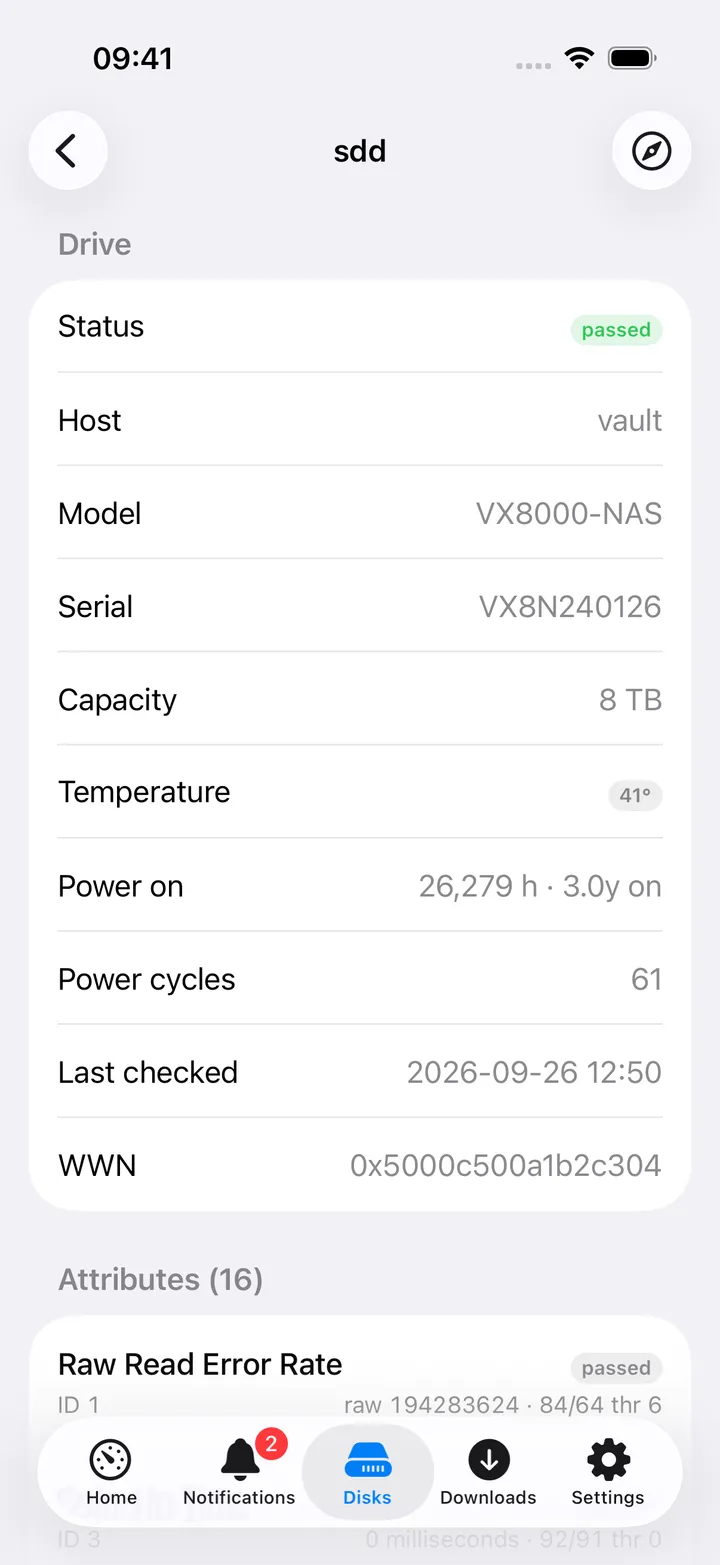
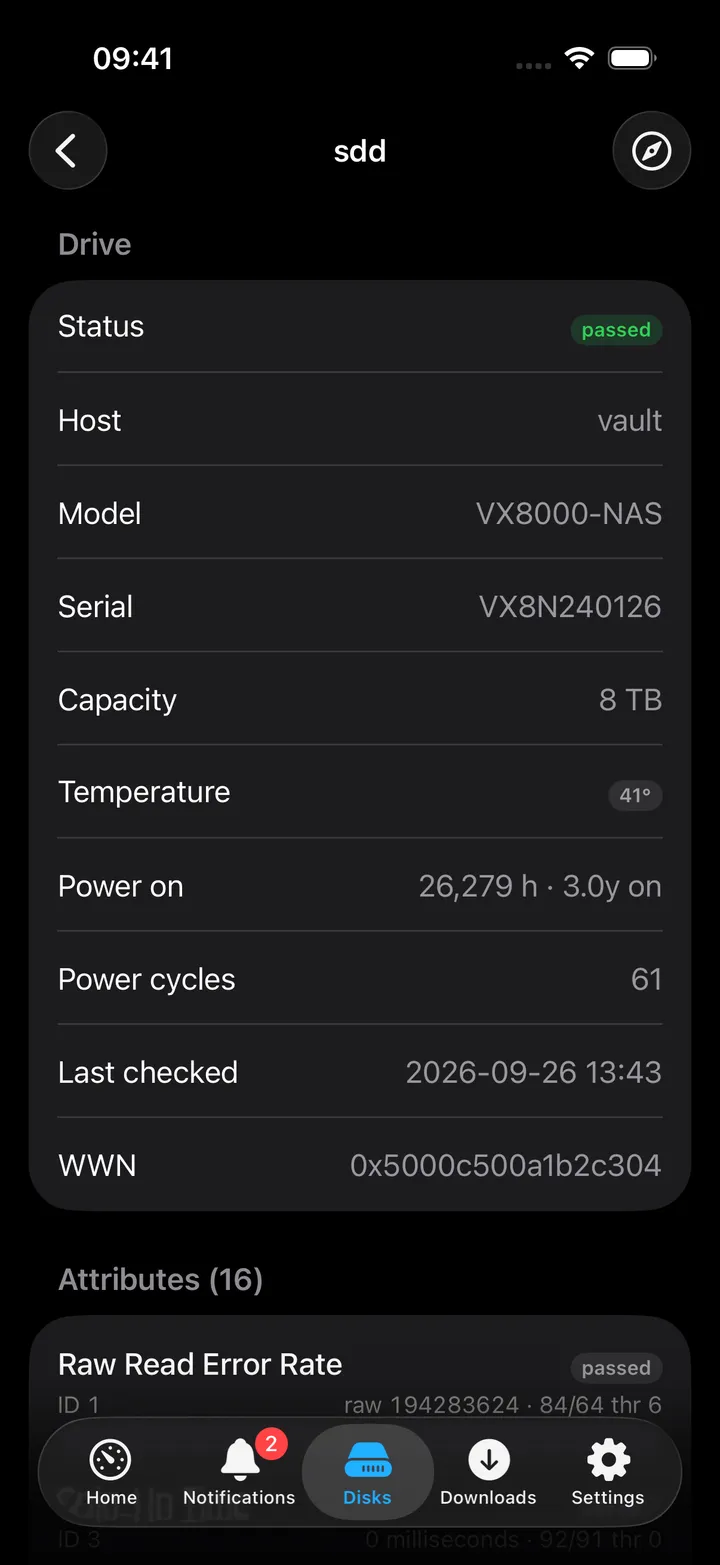
Tapping a disk opens its detail: status, host, model, serial, capacity, temperature, power-on hours and cycles, last checked date, and WWN, followed by a Warnings section for any attribute with a non-zero status, and a full Attributes table underneath.
On Mac
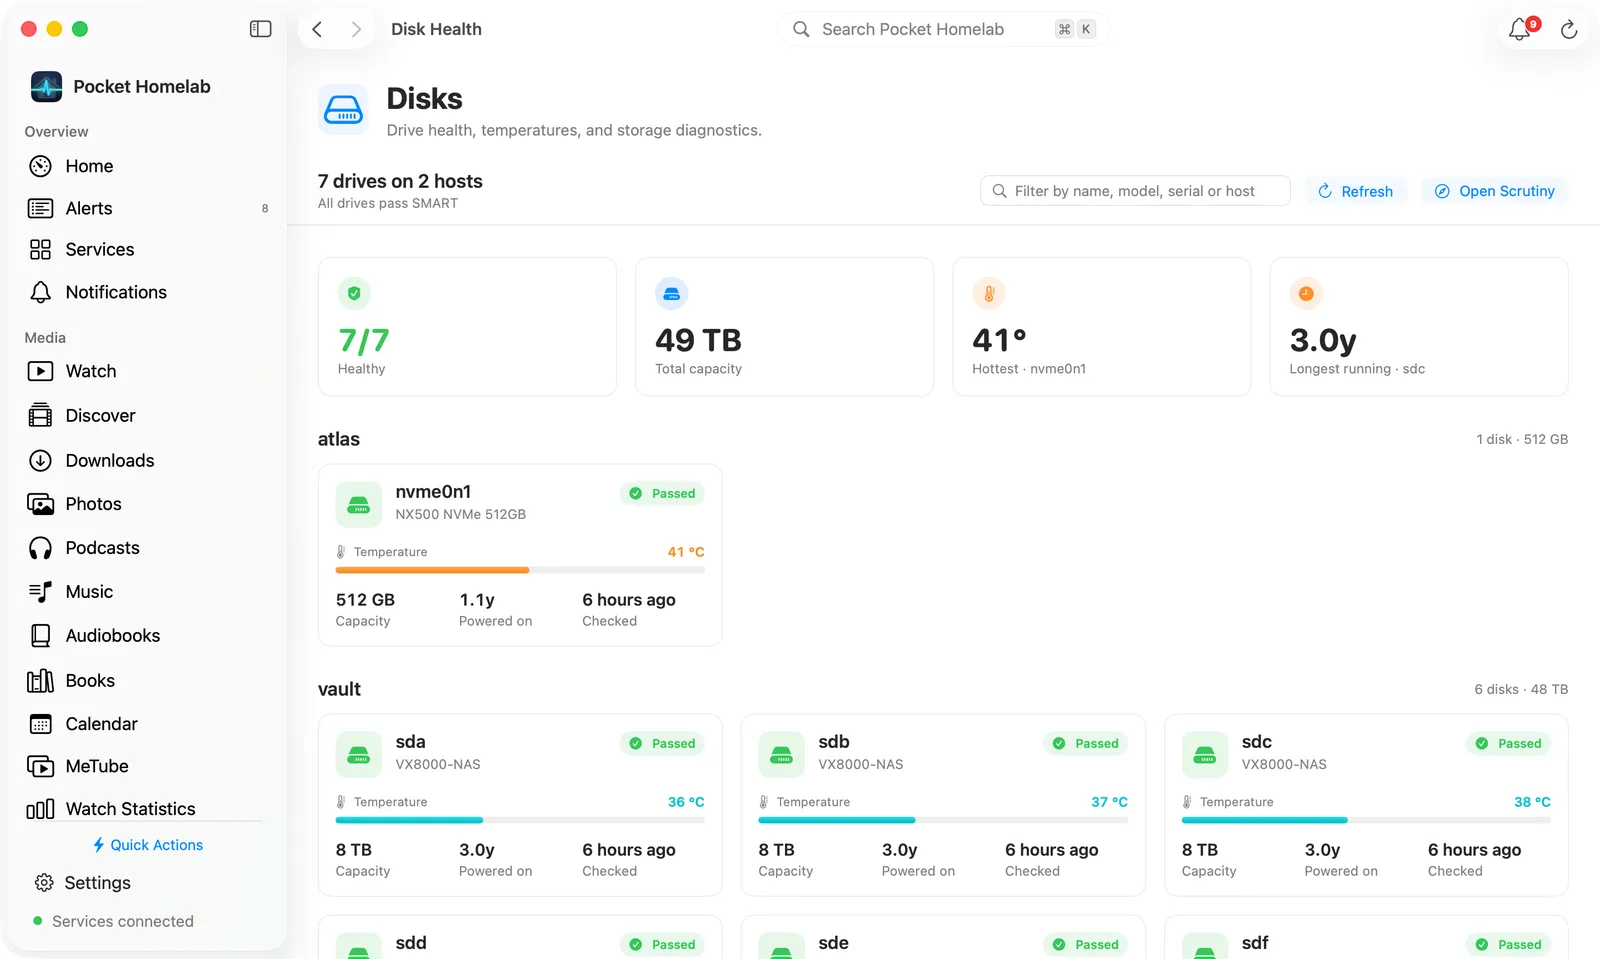
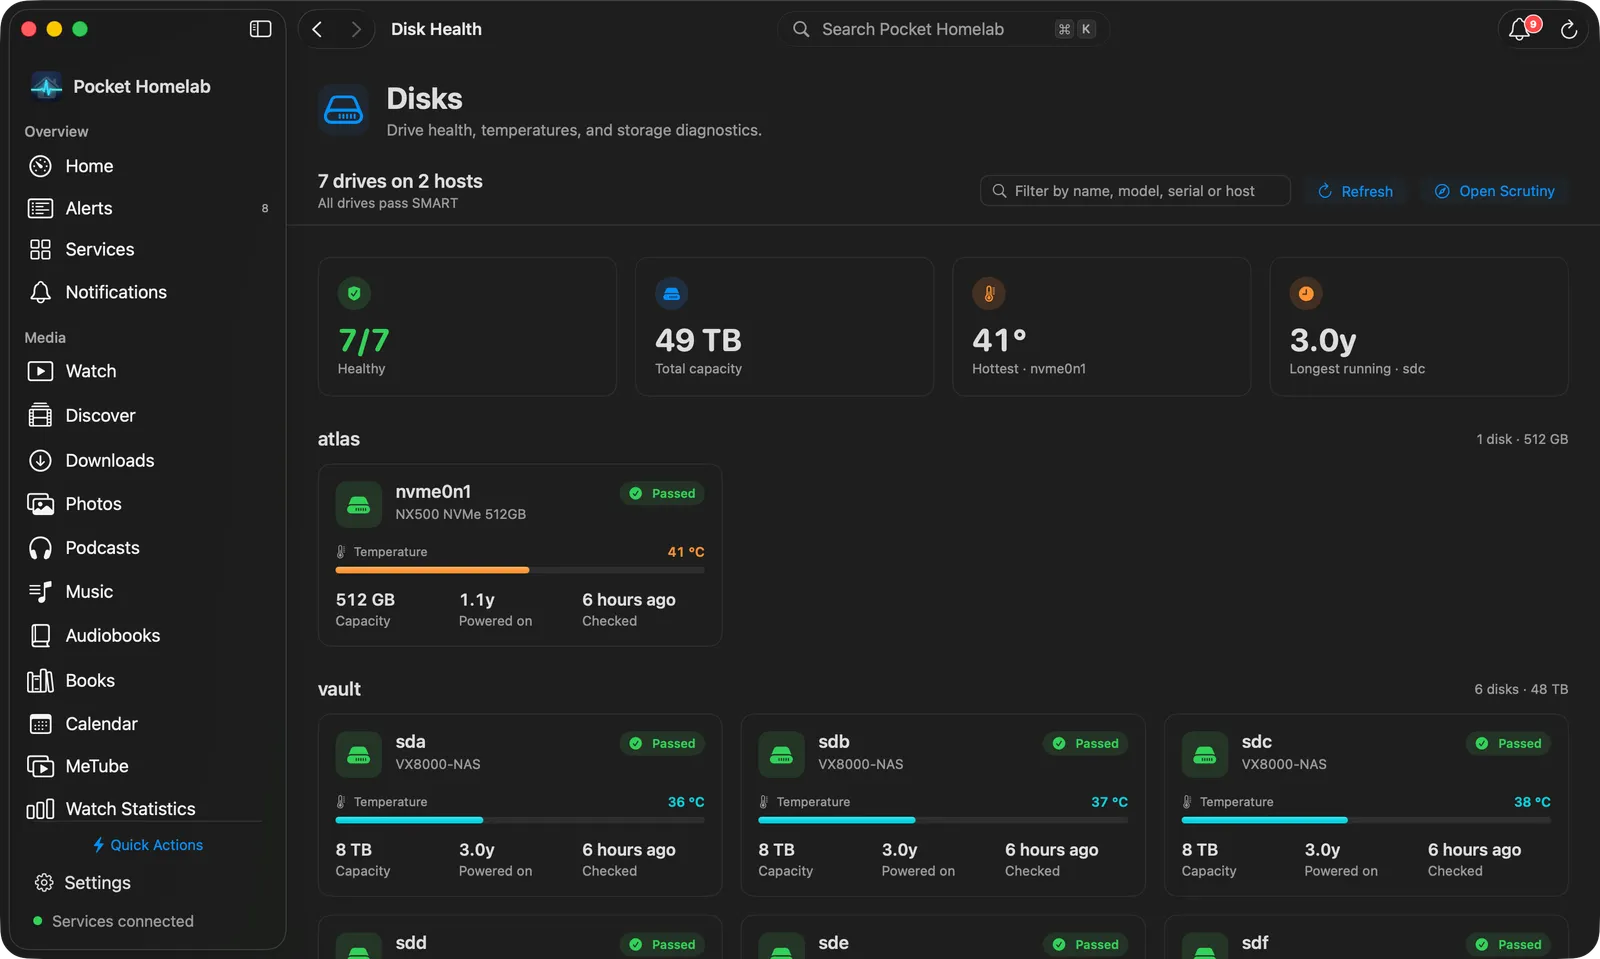
The Disks workspace (⌘8 by default, under Infrastructure in the sidebar) opens with a bar that counts your drives and hosts and says “All drives pass SMART” or how many need attention. On the right are Filter by name, model, serial or host, Refresh and Open Scrutiny.
Four tiles follow: how many drives are healthy, the total capacity, the hottest drive and the drive that has run the longest. Then each host gets a heading with its drive count and capacity, and a card per drive: name, model, a Passed or failure pill, a temperature bar (orange from 40°, red from 50°), capacity, power-on time and when Scrutiny last checked it. Right-click a card for Copy Serial and Open in Scrutiny.
Click a card to open the drive’s page. It starts with the host, name, model and capacity, a SMART passed or failure pill and a warning count, and Refresh, Open in Scrutiny and a More menu with Copy Serial and Copy WWN. A facts card shows temperature, power-on hours, power cycles, serial and the last check. Below it, Warnings and SMART attributes are tables with ID, attribute, value, worst, threshold, raw value and status; critical attributes are marked, and the reason Scrutiny gives shows under the name. Hover a name for its description; right-click a row for Copy raw value and Copy description.
Like the iPhone screen, the workspace loads the drives when you open it and does not poll; use Refresh for a new reading. Above the bar sits the workspace header “Drive health, temperatures, and storage diagnostics.”
On Home, the Disks widget shows the drive count with “all healthy” or the number of warnings, then the
SMART state, the warmest server and NAS disk from TEMPS_URL and the number checked; larger sizes list the
warnings (or the temperatures per server and NAS disk). Click the widget for its detail panel.
Actions
None. Scrutiny itself has no controls here, the whole integration is read-only.
Works with
- The Home issue chip and the Mac Home Status widget. Scrutiny’s disk list is independent of TrueNAS’s,
TrueNAS shows its own disks (and takes its temperatures from
TEMPS_URL), while Scrutiny reports its own SMART-based temperature. - Nextcloud Notes: the What needs attention block (from the
/menu or the wrench in the note toolbar) writes “all N passed” or a table of the drives with warnings, with host, problem (SMART failed or Over Scrutiny’s thresholds) and temperature. It also covers Uptime Kuma and Backrest when they are set up. The Homelab snapshot block has a Disks row.
Tips & troubleshooting
- If Scrutiny has never scanned a drive, it simply has no entry, an empty result shows “Scrutiny has no drives yet” rather than an error.
- The host prefix on a warning name (“host:sda”) is dropped automatically when Scrutiny reports no host id at all.
- Attribute IDs are numeric for ATA drives and named for NVMe/SCSI drives, both show up in the same Attributes table, numeric ones first.