
Glances
Server CPU, memory, uptime and disk usage on the Home dashboard, the Stats screen and the Mac Server page.
iPhoneMacOn this page
Glances is an open-source system monitor that exposes CPU, memory, filesystem and process data over a small HTTP API. Pocket Homelab reads that API to show your server’s vitals on the Home dashboard, a dedicated Stats screen, and the Mac Server page, read-only, no agent to install beyond Glances itself.
What you get
- Home row “Server” (a ring gauge, half or full width): “24%”/“CPU” (or RAM % or CPU °C, depending on the headline you pick), with “up 20d 5h”, “12.3 GiB RAM free”, “48° CPU”; full width adds load average, core count, RAM total, and free space on the root filesystem. The ring turns orange above 60% and red above 85%.
- Home header option “Server CPU, temperature & RAM”:
CPU 24% · 48° · load 0.52 · 12.3 GiB RAM free. - Issue chips “CPU 92%” (above 85%) and “CPU 84°” (above 80°, needs
TEMPS_URL). - Quick action “Server stats” and Spotlight entry “Server” (keywords cpu, ram, memory, glances, stats, processes, temperature).
- Mac: the Server page in the sidebar’s Infrastructure group, a Server widget on Home, a Server entry in the Home Status widget with status Healthy / High load / Partial data / Unavailable, and CPU usage beside the menu bar icon (the menu bar readings are yours to choose, see On Mac).
- Notes: the Server processes and Homelab snapshot blocks in the note editor’s
/menu. - No notifications or app-badge involvement.
Set up
- Glances only needs its web server running with the REST API enabled, there is no account or token to create. Point Pocket Homelab at the base URL Glances listens on.
- Optionally publish a
temps.jsonfile (see below) for CPU and disk temperatures, which Glances’ API does not expose consistently across platforms. - In Pocket Homelab: Settings → Services → Server, paste the URL(s), then press Test connection.
| Key | Field | Required | Secret | Where to get it |
|---|---|---|---|---|
GLANCES_URL | Glances URL | Required | — | Base URL of your Glances instance. Leave empty to hide Glances features. |
STORAGE_MOUNT | Extra Mount Point | Optional | — | A second filesystem from Glances to show next to / (e.g. a data SSD). Leave empty to show only the root filesystem. |
TEMPS_URL | Temperatures JSON URL | Optional | — | URL of a temps.json you publish yourself (server CPU/disk + NAS disk temperatures). |
Publishing temps.json
Glances’ own temperature sensors vary a lot by OS and hardware, so Pocket Homelab reads them from a small JSON file
you publish yourself (a cron job or script writing to a path your web server serves), pointed to by TEMPS_URL:
{
  "server": {
    "cpu":   { "temp": 55, "warn": 85 },
    "disks": [ { "name": "/", "temp": 38, "warn": 50 }, { "name": "/mnt/storage", "temp": 41, "warn": 50 } ]
  },
  "nas": {
    "disks": [ { "name": "da0", "temp": 41, "warn": 50 }, { "name": "da1", "temp": 44, "warn": 50 } ]
  }
}- Every object is optional,
server,server.cpu,server.disks,nas,nas.diskscan all be omitted. - A reading needs
temp(°C).warnis optional (0 = no warning threshold);namedefaults to “CPU” or “?”. - Server disk readings match Stats rows by name = mount point:
"/"for the system disk, yourSTORAGE_MOUNTvalue for the extra one. NAS disk readings match TrueNAS disks by name or suffix ("/dev/da0"matches"da0"). - The file is fetched with the same timeout as everything else; a failure shows as
temps.json: …under Errors.
On iPhone
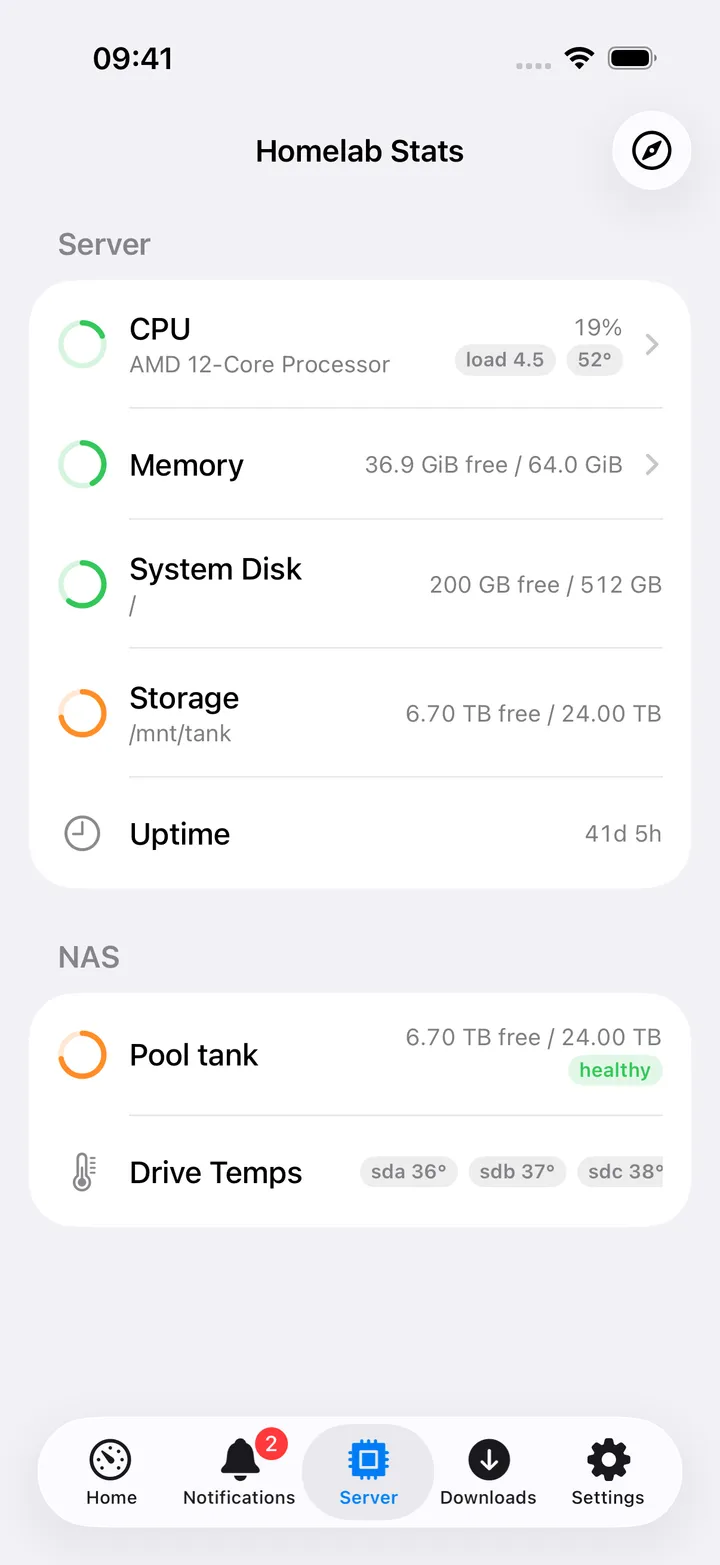
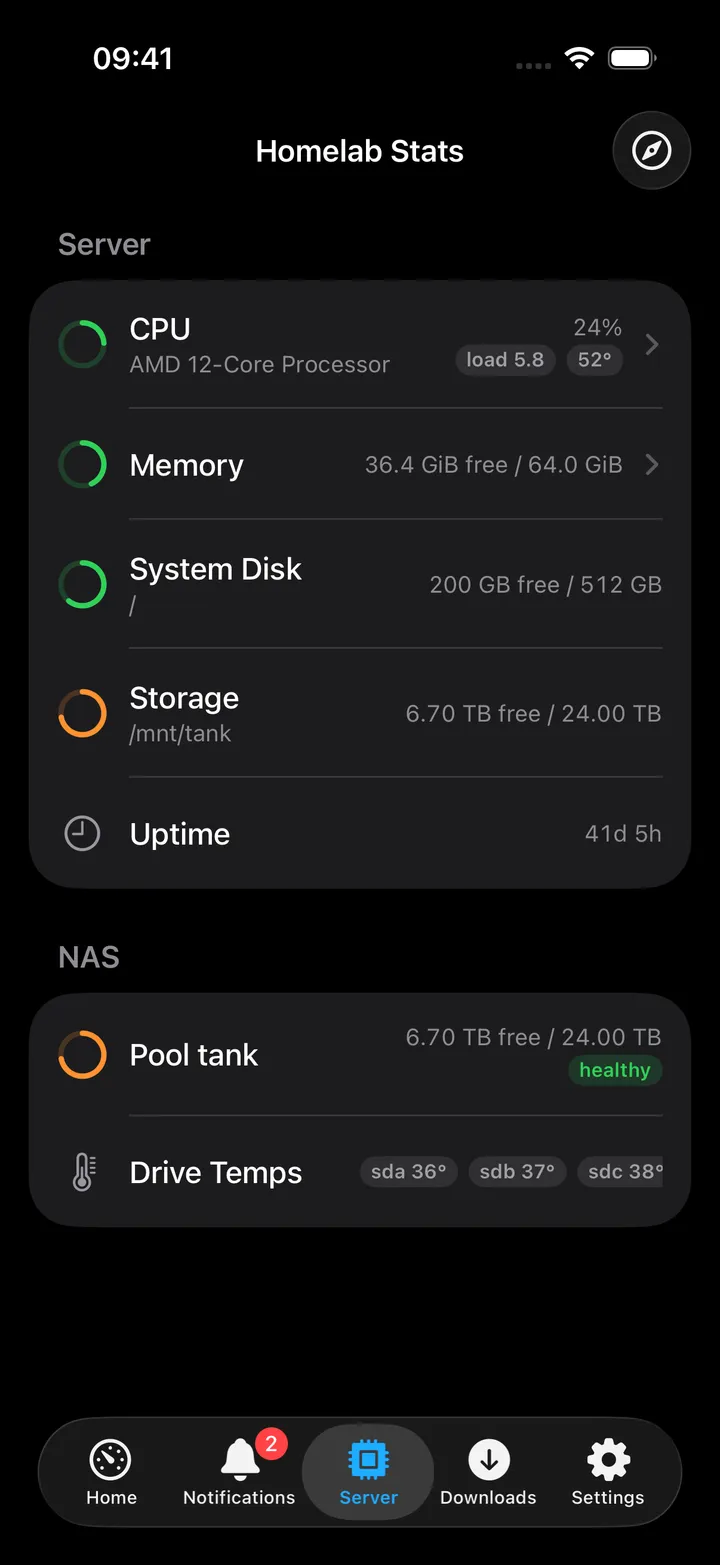
Tap the Home card, or use the “Server stats” quick action, to open Homelab Stats. It shows a Server section (CPU with a link to Top Processes, Memory, System Disk, Storage, Uptime) and, if TrueNAS is configured, a NAS section with pool status and drive temperatures. An Errors section lists any source that failed without blanking the rest, a stale reading beats no reading. The toolbar’s Safari menu has Open Homepage, Open Glances and Open TrueNAS. The screen refreshes every 15 seconds while open.
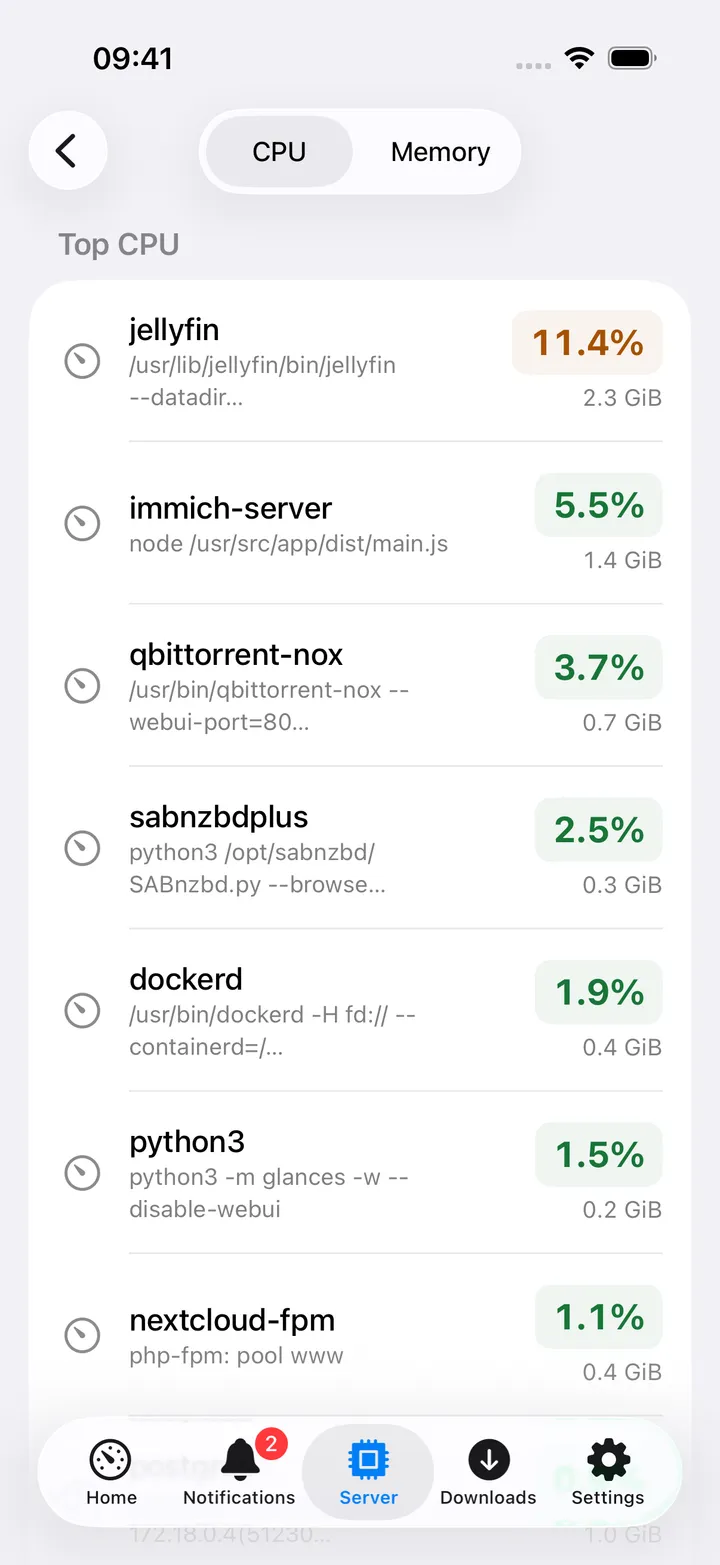
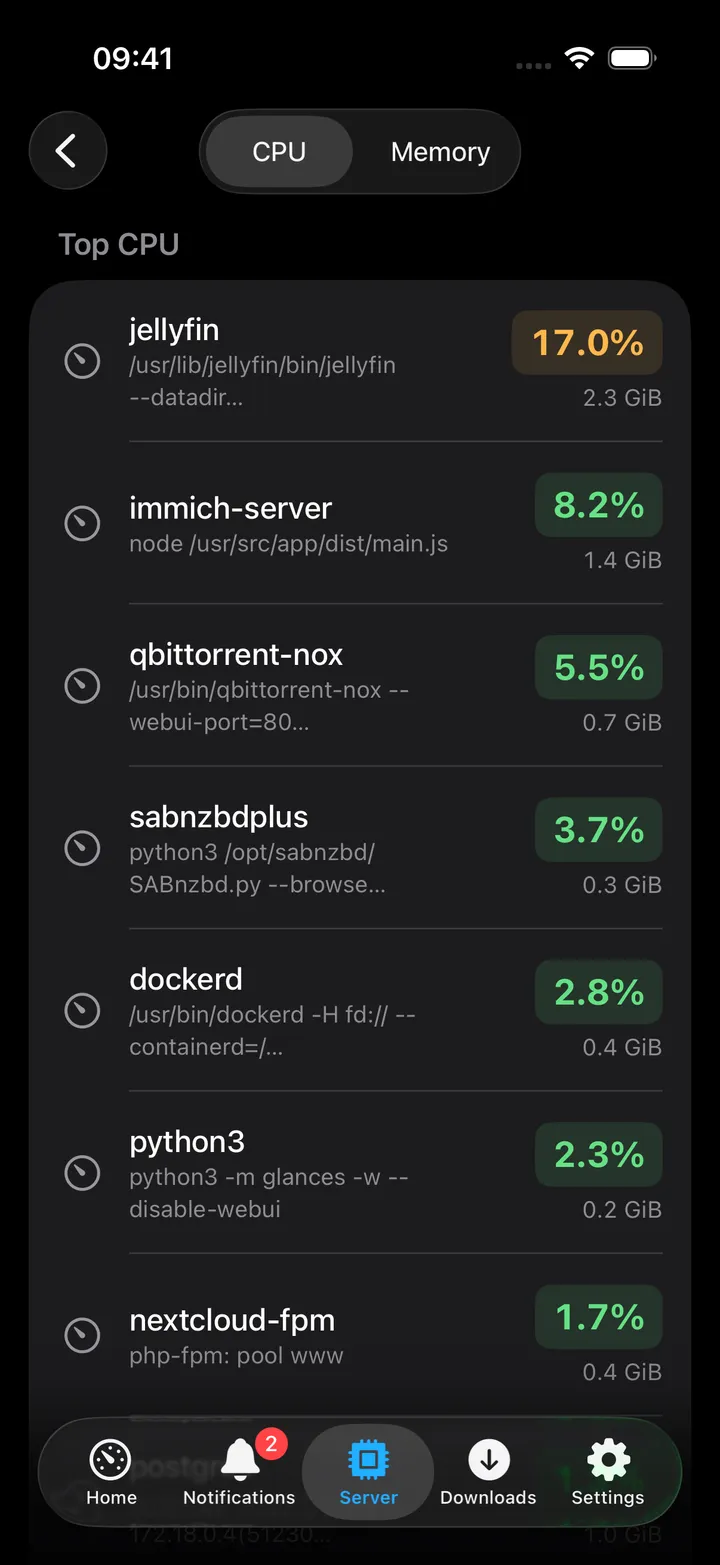
Tapping CPU or Memory opens Top Processes, a segmented CPU/Memory list of the ten heaviest processes with name, truncated command, and a colour-coded percentage pill. The process list (about 1 MB) is only fetched once you open this screen, not on every poll.
On Mac
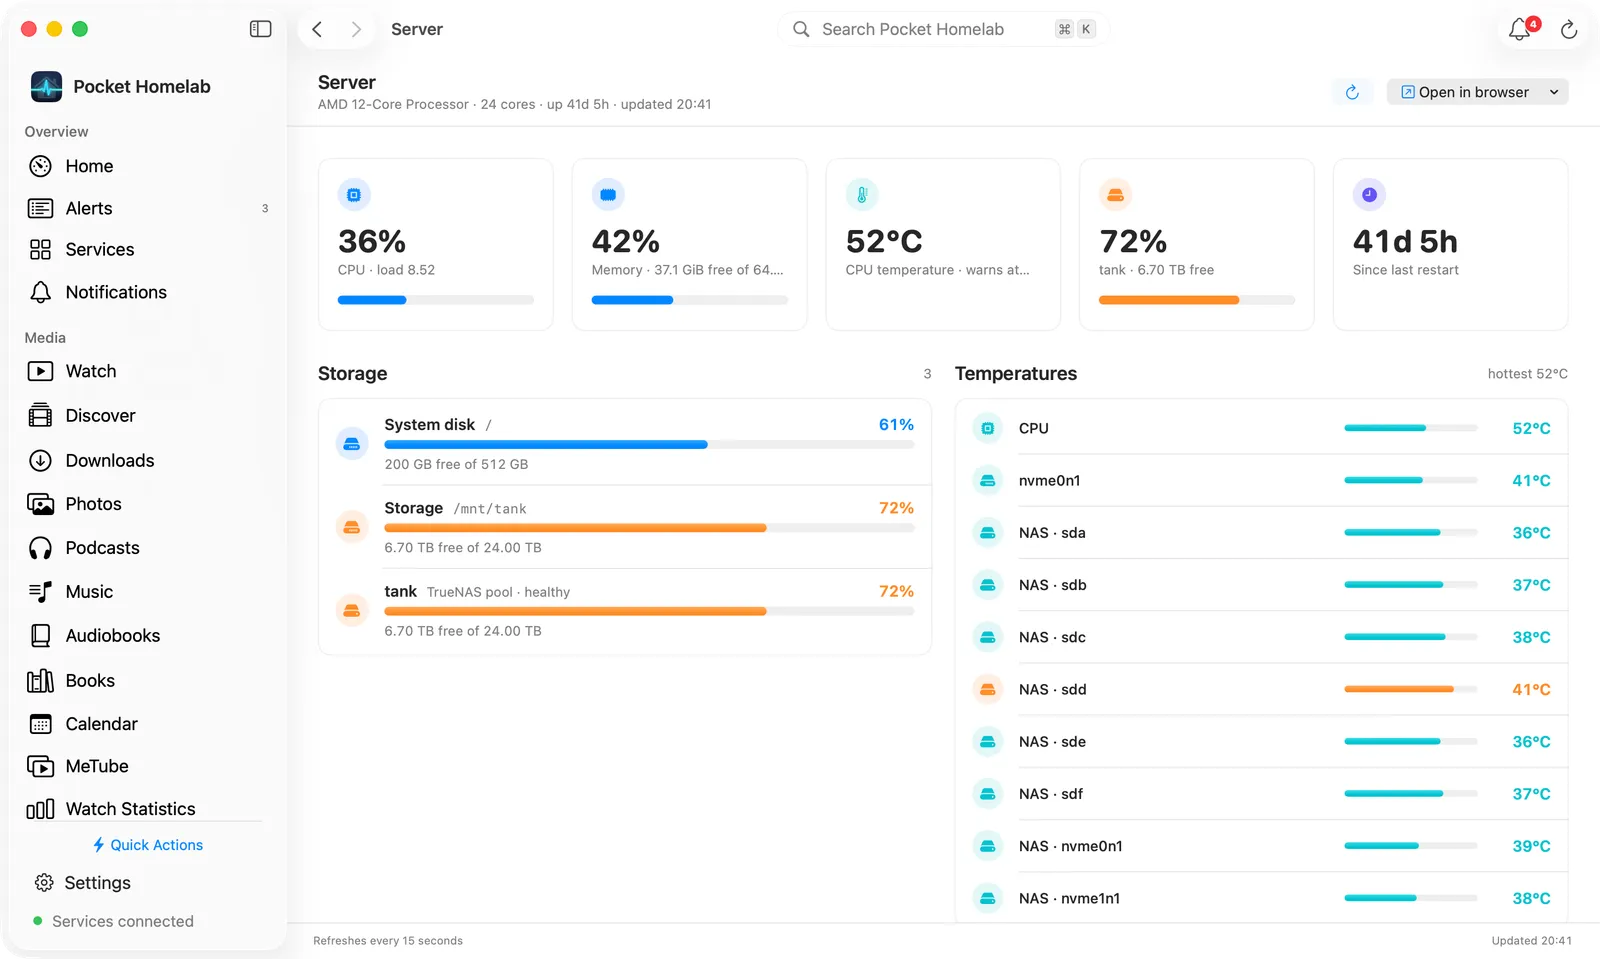
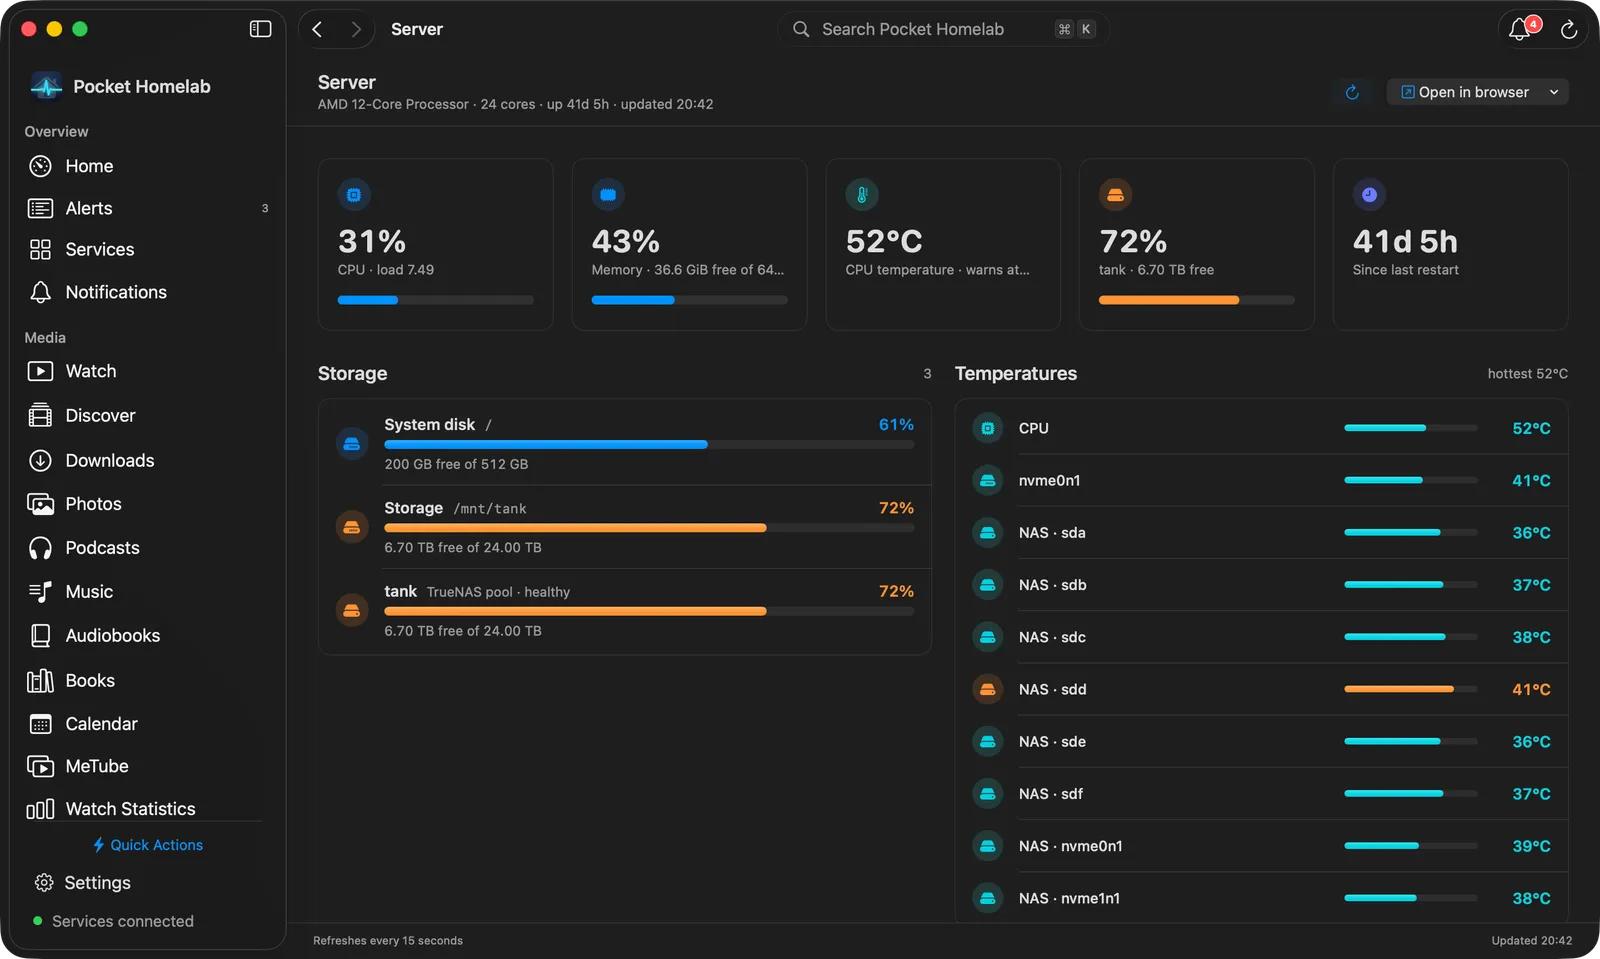
The Server page (⌘6 by default) opens with a bar: the title Server over your processor, core count, uptime and the time of the last update, a Refresh button (⌘R) and an Open in browser menu with Open Glances, Open Homepage and Open TrueNAS (whichever you set up).
Below it, a row of tiles:
- CPU: usage in percent with the 1-minute load, and a usage bar.
- Memory: percent used, with free of total in GiB.
- CPU temperature (with
TEMPS_URL): turns orange within 15 °C of its warning threshold and red at it. - Your TrueNAS pool (with TrueNAS set up): percent used and free space; red when the pool is not healthy.
- Uptime: time since the last restart.
Usage tiles and bars are blue, orange from 70% and red from 90%.
Next come two cards side by side. Storage has a row per filesystem (System disk for /, Storage for
your STORAGE_MOUNT) and one for the TrueNAS pool, each with a usage bar and “free of total”. Temperatures
lists every reading from temps.json (CPU, server disks, NAS disks as “NAS · da0”) with a bar towards the warning
threshold and the hottest reading in its header; hover a row to see where it warns.
Top processes switches between CPU and Memory and shows the ten heaviest processes as rows: name over the command, PID, CPU and memory, with a bar on the figure the list is ranked by. Click a row to unfold its full command with a Copy button; right-click for Copy command and Copy PID. On the Mac the process list is fetched with every refresh while the page is open. Without a Glances URL the card says “Connect Glances in Settings to inspect CPU, memory, and running processes.”
The footer reads “Refreshes every 15 seconds” with the time of the last update. With nothing set up, the page shows Connect your server and an Open Settings button.
On Home, the Server widget shows a CPU ring, the CPU temperature and core count, then RAM free and used, uptime, the hottest server disk, processor, volume count, load average and RAM total; larger sizes add CPU, memory and temperature history. Click the widget for its detail panel.
The menu bar item shows CPU usage beside the icon by default, and its menu has CPU and memory cards. In
Settings → Menu Bar you choose the readings for both: CPU usage, load average, memory used or available, server
uptime, free, used or total space of / or your extra mount, CPU temperature and the warmest server disk (the last
two need TEMPS_URL).
Actions
None. Everything here is read-only, Glances itself has no controls to trigger from Pocket Homelab.
Works with
- TrueNAS: the first storage pool appears in the same Stats screen’s NAS section and as a tile and a Storage row on the Mac Server page.
temps.jsondecorates both server disks and TrueNAS/NAS disks with temperature tags.- An Uptime Kuma monitor named “Server” or “Glances” supplies the latency shown for this service in the Mac Home Status widget.
HOMEPAGE_URLadds an “Open Homepage” toolbar entry alongside Glances and TrueNAS.- Nextcloud Notes: the Server processes block (from the
/menu or the wrench in the note toolbar) writes the eight heaviest processes by CPU and by memory into the note as two tables, stamped with the time. It is offered once a Glances URL is set. The Homelab snapshot block includes a Server row and a Storage row.
Tips & troubleshooting
- A temps-only setup (no
GLANCES_URL) still shows the Server card ifTEMPS_URLor TrueNAS is configured, but Test connection has nothing to check: it needs a Glances URL and reports “Glances URL is not set” without one. - Partial failures keep the last good numbers instead of blanking to a dash, only a fully broken source shows empty.
- Numbers follow the same units as Homepage: RAM in binary GiB, disk capacity in decimal GB/TB.